Mastering Data Visualization and Animation with Python
Sjoerd Tilmans
54:05
Description
From Static to Dynamic: A Guide to Crafting Compelling Data Stories with Python's Visualization and Animation Libraries
What You'll Learn?
- Learn how to make beautiful and engaging data animations perfect for sharing on social media
- Start building an data analytics portfolio
- Learn how to use the jupyter notebook environment
- Learn basic concepts of Python programming
- Learn how to take data from an Excel file to a finished data visualization
- Finish this course with a set of data visualization templates you can reuse
Who is this for?
What You Need to Know?
More details
DescriptionThis course is designed to teach you how to create dynamic and engaging data visualizations using Python. You will learn how to use Python's powerful libraries to create stunning animated visualizations.
This course is designed to teach you how to create stunning data animations that can help you in your next big presentation and are ideal for sharing on social media platforms. You will learn how to transform static data into captivating and dynamic visuals that tell a story and captivate your audience. This course is broken down into bite-sized pieces, and we will use fun real-world data in all the lectures. By the end of the course, you will have a set of data visualization templates that you can reuse over and over again.
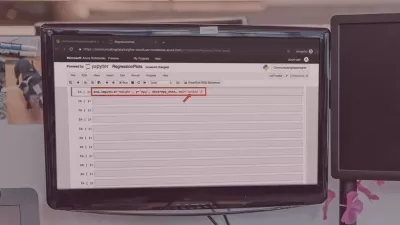
The best part is that there are no prerequisites for this course other than a willingness to learn some basic Python programming concepts. In terms of content, we will start with setting up Python and Jupyter Notebook. You will then learn basic Python programming concepts, and within 15 minutes of starting the course, you will have your first data animation.
Whether you work in data science or data analytics, or aspire to work in those fields and start building your portfolio, this course is for you if you are looking to expand your data visualization skillset.
Who this course is for:
- Beginner data analyst looking to build a data analytics portfolio
This course is designed to teach you how to create dynamic and engaging data visualizations using Python. You will learn how to use Python's powerful libraries to create stunning animated visualizations.
This course is designed to teach you how to create stunning data animations that can help you in your next big presentation and are ideal for sharing on social media platforms. You will learn how to transform static data into captivating and dynamic visuals that tell a story and captivate your audience. This course is broken down into bite-sized pieces, and we will use fun real-world data in all the lectures. By the end of the course, you will have a set of data visualization templates that you can reuse over and over again.
The best part is that there are no prerequisites for this course other than a willingness to learn some basic Python programming concepts. In terms of content, we will start with setting up Python and Jupyter Notebook. You will then learn basic Python programming concepts, and within 15 minutes of starting the course, you will have your first data animation.
Whether you work in data science or data analytics, or aspire to work in those fields and start building your portfolio, this course is for you if you are looking to expand your data visualization skillset.
Who this course is for:
- Beginner data analyst looking to build a data analytics portfolio
User Reviews
Rating

Sjoerd Tilmans
Instructor's Courses
Udemy
View courses Udemy- language english
- Training sessions 10
- duration 54:05
- Release Date 2023/06/12