Mastering Data Magic : Power BI + Tableau + SQL , Analytics
ZK Tutorials
9:33:24
Description
Data Analytics with Power BI , Tableau and SQL
What You'll Learn?
- Introduction to Power BI
- How to download and Install Power BI Desktop
- Understanding Interface
- Data Sources and Uploading Sample Data
- Building Charts
- Visual Interactions
Who is this for?
What You Need to Know?
More details
DescriptionData Analytics: Data analytics is the process of examining, cleaning, transforming, and interpreting data to extract meaningful insights, patterns, and trends. It helps organizations make informed decisions and improve their business performance by leveraging data.
Why Data Analytics: Data analytics is crucial for businesses to make data-driven decisions. It enables organizations to:
Identify trends and opportunities.
Improve operational efficiency.
Enhance customer experience.
Make informed strategic decisions.
Predict future outcomes.
Types of Data Analytics: There are four main types of data analytics:
Descriptive Analytics: Summarizes historical data to provide insights.
Diagnostic Analytics: Analyzes data to understand why certain events occurred.
Predictive Analytics: Uses historical data to predict future outcomes.
Prescriptive Analytics: Recommends actions based on predictive analytics.
Steps Involved in Data Analytics: The typical steps in data analytics include data collection, data cleaning, data exploration, data modeling, data visualization, and interpretation of results.
Tools for Data Analytics: There are various tools for data analytics, including Power BI, Tableau, Excel, Python (with libraries like Pandas and Matplotlib), R, and more.
Skills for Data Analytics: To excel in data analytics, you should have skills in data manipulation, statistical analysis, data visualization, domain knowledge, and problem-solving. Soft skills like communication and teamwork are also essential.
Downloading and Installing Power BI Desktop: You can download Power BI Desktop from the official Microsoft website. After downloading, run the installer and follow the installation instructions.
Understanding Interface, Options, and Settings: Power BI Desktop has a user-friendly interface with options and settings to customize your workspace, data sources, and report layouts.
Data Source and Uploading Sample Data: You can connect Power BI to various data sources, such as databases, Excel files, and web services. You can also import sample data to practice.
Understanding Data and Basic Data Types: In Power BI, you must understand your data's structure, data types (e.g., text, numbers, dates), and how to clean and transform it for analysis.
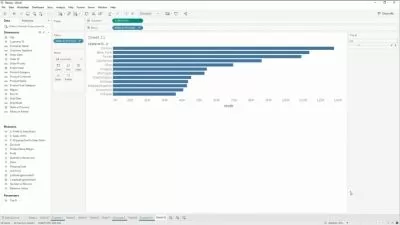
Building Charts: Power BI allows you to create various visualizations, including bar charts, line charts, pie charts, and more, to represent your data effectively.
Visual Interactions: You can set up interactions between visuals to create dynamic reports where selecting one visual influences others.
Formatting: You can format visuals, fonts, colors, and backgrounds to make your reports visually appealing and easier to understand.
Web Scraping: Power BI can extract data from websites using web scraping techniques, allowing you to incorporate external data sources.
Data Modeling: You can create relationships between tables, define measures, and build a data model for accurate analysis and reporting.
RDBMS Introduction: Relational Database Management Systems (RDBMS) like SQL Server, MySQL, and Oracle can be connected to Power BI to fetch data.
Map Visualization: Power BI supports mapping visualizations to display data geospatially, making it useful for location-based analysis.
Saving Power BI Files: You can save your Power BI reports as .pbix files, which can be shared and opened by others using Power BI Desktop.
Scatter Plot and Other Features: Scatter plots are useful for visualizing the relationship between two numeric variables. Power BI also offers many other features like filtering, drill-through, and custom visuals.
Conditional Formatting: You can apply conditional formatting to visuals to highlight specific data points based on predefined rules.
Hiding Tables in Report View: You can hide tables or fields that you don't want to display in the report view to declutter your workspace.
Grouping, Bar Charts, Column Charts, Ribbon Charts, Small Multiples: These are various visualization types that you can create in Power BI to represent your data in different ways, such as grouping data, using bar or column charts, ribbon charts, and displaying small multiples for comparative analysis.
Power BI is a powerful tool for data analytics, and mastering these topics will help you create informative and visually appealing reports for data-driven decision-making.
Who this course is for:
- This course is designed for data enthusiasts, analysts, business professionals, and anyone looking to harness the power of Power BI for in-depth data analysis and visualization.
Data Analytics: Data analytics is the process of examining, cleaning, transforming, and interpreting data to extract meaningful insights, patterns, and trends. It helps organizations make informed decisions and improve their business performance by leveraging data.
Why Data Analytics: Data analytics is crucial for businesses to make data-driven decisions. It enables organizations to:
Identify trends and opportunities.
Improve operational efficiency.
Enhance customer experience.
Make informed strategic decisions.
Predict future outcomes.
Types of Data Analytics: There are four main types of data analytics:
Descriptive Analytics: Summarizes historical data to provide insights.
Diagnostic Analytics: Analyzes data to understand why certain events occurred.
Predictive Analytics: Uses historical data to predict future outcomes.
Prescriptive Analytics: Recommends actions based on predictive analytics.
Steps Involved in Data Analytics: The typical steps in data analytics include data collection, data cleaning, data exploration, data modeling, data visualization, and interpretation of results.
Tools for Data Analytics: There are various tools for data analytics, including Power BI, Tableau, Excel, Python (with libraries like Pandas and Matplotlib), R, and more.
Skills for Data Analytics: To excel in data analytics, you should have skills in data manipulation, statistical analysis, data visualization, domain knowledge, and problem-solving. Soft skills like communication and teamwork are also essential.
Downloading and Installing Power BI Desktop: You can download Power BI Desktop from the official Microsoft website. After downloading, run the installer and follow the installation instructions.
Understanding Interface, Options, and Settings: Power BI Desktop has a user-friendly interface with options and settings to customize your workspace, data sources, and report layouts.
Data Source and Uploading Sample Data: You can connect Power BI to various data sources, such as databases, Excel files, and web services. You can also import sample data to practice.
Understanding Data and Basic Data Types: In Power BI, you must understand your data's structure, data types (e.g., text, numbers, dates), and how to clean and transform it for analysis.
Building Charts: Power BI allows you to create various visualizations, including bar charts, line charts, pie charts, and more, to represent your data effectively.
Visual Interactions: You can set up interactions between visuals to create dynamic reports where selecting one visual influences others.
Formatting: You can format visuals, fonts, colors, and backgrounds to make your reports visually appealing and easier to understand.
Web Scraping: Power BI can extract data from websites using web scraping techniques, allowing you to incorporate external data sources.
Data Modeling: You can create relationships between tables, define measures, and build a data model for accurate analysis and reporting.
RDBMS Introduction: Relational Database Management Systems (RDBMS) like SQL Server, MySQL, and Oracle can be connected to Power BI to fetch data.
Map Visualization: Power BI supports mapping visualizations to display data geospatially, making it useful for location-based analysis.
Saving Power BI Files: You can save your Power BI reports as .pbix files, which can be shared and opened by others using Power BI Desktop.
Scatter Plot and Other Features: Scatter plots are useful for visualizing the relationship between two numeric variables. Power BI also offers many other features like filtering, drill-through, and custom visuals.
Conditional Formatting: You can apply conditional formatting to visuals to highlight specific data points based on predefined rules.
Hiding Tables in Report View: You can hide tables or fields that you don't want to display in the report view to declutter your workspace.
Grouping, Bar Charts, Column Charts, Ribbon Charts, Small Multiples: These are various visualization types that you can create in Power BI to represent your data in different ways, such as grouping data, using bar or column charts, ribbon charts, and displaying small multiples for comparative analysis.
Power BI is a powerful tool for data analytics, and mastering these topics will help you create informative and visually appealing reports for data-driven decision-making.
Who this course is for:
- This course is designed for data enthusiasts, analysts, business professionals, and anyone looking to harness the power of Power BI for in-depth data analysis and visualization.
User Reviews
Rating

ZK Tutorials
Instructor's Courses
Udemy
View courses Udemy- language english
- Training sessions 24
- duration 9:33:24
- English subtitles has
- Release Date 2023/12/30