Companies Home Search Profile

Managing Data in R Using Data Frames

Focused View

Martin Burger

2:00:59

75 View
  • 1. Course Overview.mp4
    01:41
  • 1. Intro.mp4
    01:23
  • 2. Managing Expectations.mp4
    05:09
  • 3. Course Dataset.mp4
    01:39
  • 4. Data Import.mp4
    05:34
  • 5. Working with Factors and Strings.mp4
    06:00
  • 6. Updating R Objects.mp4
    03:00
  • 7. Summary.mp4
    01:33
  • 1. Intro.mp4
    01:28
  • 2. Working on Column Names.mp4
    05:54
  • 3. Orientation in a Dataset.mp4
    03:26
  • 4. Using Summary Statistics.mp4
    06:15
  • 5. Contingency Tables for Factors.mp4
    06:14
  • 6. The Main Chart Types.mp4
    03:41
  • 7. Data Visualization for Exploration.mp4
    06:36
  • 8. Detecting Missing Data.mp4
    04:29
  • 9. Summary.mp4
    01:29
  • 1. Intro.mp4
    01:39
  • 2. Splitting Strings.mp4
    08:37
  • 3. Adding and Removing Columns.mp4
    04:15
  • 4. Adding External Variables via Joins.mp4
    04:37
  • 5. Variable Transformations.mp4
    02:45
  • 6. Aggregate Statistics.mp4
    08:00
  • 7. Summary.mp4
    01:36
  • 1. Intro.mp4
    01:15
  • 2. Exporting Clean Data.mp4
    02:43
  • 3. Getting Help in R.mp4
    07:19
  • 4. Using Online Resources.mp4
    08:44
  • 5. Course Summary.mp4
    03:58
  • Description


    Learn how to use and reshape data frames in R. The course also covers common alternatives to the data frame like tibble and data table.

    What You'll Learn?


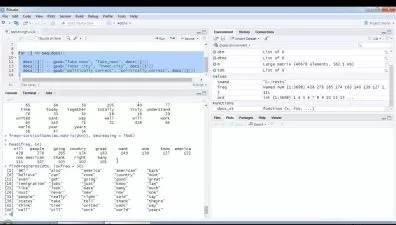
      Learn to work with very popular and versatile tabular data types in R. When using R, there is no way around the data frame and its alternatives. In this course, Managing Data in R Using Data Frames, you will learn that tabular data (data.frame, data.table, tibble) are the standard data type in R and most of the analyses performed in R use this data format. First, you will discover how to manipulate and reshape a raw data frame. Then, you will explore the common tasks such as table import, factor conversion, formatting of a table header, orientation in a table, column splits, column removal and addition, fusion of multiple tables, variable transformations, query, as well as export of a table. Finally, you will produce a clean data frame which can be used for detailed analysis or passed on to team members.

      When you complete this course, you’ll have the skills and knowledge to perform standard tasks on data frames and can understand the many advantages of a data frame.

    More details


    User Reviews
    Rating
    0
    0
    0
    0
    0
    average 0
    Total votes0
    Focused display
    Martin Burger
    Martin Burger
    Instructor's Courses
    Martin studied biostatistics and worked for several pharmaceutical companies before he became a data science consultant and author. He published over 15 courses on R, Tableau 9 and other data science related subjects. His main focus lies on analytics software like R and SPSS but he is also interested in modern data visualization tools like Tableau. If he is not busy coding, blogging or working out new teaching concepts you may find him skiing or hiking in the Alps.
    Pluralsight, LLC is an American privately held online education company that offers a variety of video training courses for software developers, IT administrators, and creative professionals through its website. Founded in 2004 by Aaron Skonnard, Keith Brown, Fritz Onion, and Bill Williams, the company has its headquarters in Farmington, Utah. As of July 2018, it uses more than 1,400 subject-matter experts as authors, and offers more than 7,000 courses in its catalog. Since first moving its courses online in 2007, the company has expanded, developing a full enterprise platform, and adding skills assessment modules.
    • language english
    • Training sessions 29
    • duration 2:00:59
    • level average
    • English subtitles has
    • Release Date 2023/08/01

    Courses related to Data Science

    Courses related to R Programming