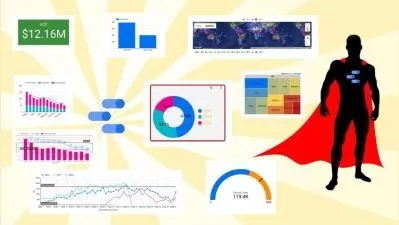
Looker and Looker Studio: Google's Data Visualization Tools
Start-Tech Academy
11:44:02
Description
Learn Google's Data Visualization tools - Looker and Looker Studio (previously Google Data Studio) + LookML for Devs
What You'll Learn?
- How to use Looker and Looker Studio to turns your data into fully customizable informative reports and dashboards
- Learn why businesses should use Looker to explore their data
- How to visualize data using popular chart types in Looker and Looker Studio
- Filter and sort data to find the right answer for your business questions
- Sharing and collaborating on Looker studio reports
- Branding a report - Adding Logo and setting theme
- How to share and schedule charts and dashboards with team mates
Who is this for?
More details
Description5 Reasons why you should choose this Google Looker and Looker Studio course
Carefully designed course, teaching you not only how to draw all types of charts in Looker and Looker Studio
Concise - you can complete this Looker and Looker Studio course within a week
Business-related examples and case studies
Downloadable resources for learning Data Visualization
Your queries will be responded by the Instructor himself
Start using Google's Looker and Looker Studio to their full potential to become proficient at Looker and Data Visualization and reporting tasks today!
Either you're new to Data Visualization or Google Looker and Looker Studio, or you've made some charts and graphs using some data visualization software such as MS Excel or Tableau. Either way, this course will be great for you.
A Verifiable Certificate of Completion is presented to all students who undertake this Google Looker course.
Why should you choose this course?
This is a complete and concise tutorial on Google Looker which can be completed within 6 hours. We know that your time is important and hence we have created this fast paced course without wasting time on irrelevant operations.
What makes us qualified to teach you?
The course is taught by Abhishek and Pukhraj. Instructors of the course have been teaching Data Science and Machine Learning for over a decade. We have in-depth understanding on and practical exposure to Google Looker and Data Visualization.
We are also the creators of some of the most popular online courses - with over 600,000 enrollments and thousands of 5-star reviews like these ones:
I had an awesome moment taking this course. It broaden my knowledge more on the power use of Excel as an analytical tools. Kudos to the instructor! - Sikiru
Very insightful, learning very nifty tricks and enough detail to make it stick in your mind. - Armand
Our Promise
Teaching our students is our job and we are committed to it. If you have any questions about the course content, Google Looker, Data Visualization, practice sheet or anything related to any topic, you can always post a question in the course or send us a direct message.
And so much more!
By the end of this course, your confidence in using Google Looker for data visualization will soar. You'll have a thorough understanding of how to use Google Looker for creating insightful dashboards and beautiful reports.
Go ahead and click the enroll button, and I'll see you in lesson 1 of this Google Data Studio course!
Cheers
Start-Tech Academy
Who this course is for:
- Students who wish to join the field of analytics
- Working professionals looking to learn a powerful dashboarding and Data Visualization tool
- Anyone who wants to learn about Looker and LookML from the very beginning
5 Reasons why you should choose this Google Looker and Looker Studio course
Carefully designed course, teaching you not only how to draw all types of charts in Looker and Looker Studio
Concise - you can complete this Looker and Looker Studio course within a week
Business-related examples and case studies
Downloadable resources for learning Data Visualization
Your queries will be responded by the Instructor himself
Start using Google's Looker and Looker Studio to their full potential to become proficient at Looker and Data Visualization and reporting tasks today!
Either you're new to Data Visualization or Google Looker and Looker Studio, or you've made some charts and graphs using some data visualization software such as MS Excel or Tableau. Either way, this course will be great for you.
A Verifiable Certificate of Completion is presented to all students who undertake this Google Looker course.
Why should you choose this course?
This is a complete and concise tutorial on Google Looker which can be completed within 6 hours. We know that your time is important and hence we have created this fast paced course without wasting time on irrelevant operations.
What makes us qualified to teach you?
The course is taught by Abhishek and Pukhraj. Instructors of the course have been teaching Data Science and Machine Learning for over a decade. We have in-depth understanding on and practical exposure to Google Looker and Data Visualization.
We are also the creators of some of the most popular online courses - with over 600,000 enrollments and thousands of 5-star reviews like these ones:
I had an awesome moment taking this course. It broaden my knowledge more on the power use of Excel as an analytical tools. Kudos to the instructor! - Sikiru
Very insightful, learning very nifty tricks and enough detail to make it stick in your mind. - Armand
Our Promise
Teaching our students is our job and we are committed to it. If you have any questions about the course content, Google Looker, Data Visualization, practice sheet or anything related to any topic, you can always post a question in the course or send us a direct message.
And so much more!
By the end of this course, your confidence in using Google Looker for data visualization will soar. You'll have a thorough understanding of how to use Google Looker for creating insightful dashboards and beautiful reports.
Go ahead and click the enroll button, and I'll see you in lesson 1 of this Google Data Studio course!
Cheers
Start-Tech Academy
Who this course is for:
- Students who wish to join the field of analytics
- Working professionals looking to learn a powerful dashboarding and Data Visualization tool
- Anyone who wants to learn about Looker and LookML from the very beginning
User Reviews
Rating
Start-Tech Academy
Instructor's Courses
Udemy
View courses Udemy- language english
- Training sessions 120
- duration 11:44:02
- Release Date 2023/02/14


