Companies Home Search Profile

Learning Microsoft Fabric: A Data Analytics and Engineering Preview

Focused View

Gini von Courter

1:30:23

70 View
  • 01 - Reshape how your entire team uses data with Microsoft Fabric.mp4
    00:27
  • 01 - Why Fabric matters.mp4
    03:56
  • 02 - What is Fabric.mp4
    03:23
  • 03 - Enable the Fabric preview.mp4
    04:24
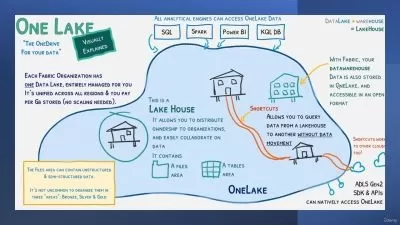
  • 01 - OneLake and Lakehouses.mp4
    04:36
  • 02 - Create a workspace.mp4
    03:21
  • 03 - Create a Lakehouse for Power BI data.mp4
    06:22
  • 04 - Explore the Lakehouse.mp4
    02:17
  • 05 - Add users to a workspace.mp4
    01:47
  • 01 - Create dataflows.mp4
    04:36
  • 02 - Load dataflows to Lakehouse.mp4
    04:07
  • 03 - Create notebooks.mp4
    05:30
  • 04 - Build visuals and AI models with notebooks.mp4
    06:02
  • 05 - Build data pipelines.mp4
    07:11
  • 06 - Create datamarts.mp4
    04:29
  • 07 - Build models in the datamart.mp4
    03:18
  • 08 - Build SQL queries and visual queries.mp4
    04:15
  • 09 - Create and use datasets.mp4
    02:33
  • 10 - Add DAX measures and select tables.mp4
    01:50
  • 01 - Autocreate a report in Fabric.mp4
    04:22
  • 02 - Create a report from scratch.mp4
    05:35
  • 03 - Promote or certify your report.mp4
    03:14
  • 01 - Fabric resources.mp4
    02:48
  • Description


    When Microsoft CEO Satya Nadella announced Fabric at the spring 2023 Build conference, he called it the most significant announcement for business data users since the launch of the first version of SQL Server. But what is Fabric? How does it work, and what does it do that will help you? In this course, Microsoft expert Gini von Courter and data analytics expert Helen Wall give you a first look at how Fabric will help your business and data initiatives. Get an overview of the current issues that Fabric was designed to solve, the components that make it up, and how to enable Fabric. Learn how to build a workspace and a lakehouse in Fabric. Find out how to create dataflows and load your dataflow to the Fabric model. Go over creating notebooks, uploading data to them, and using them to build visuals and AI models. Use Datamarts to connect multidimensional models, build pipelines to account for international holidays, and much more. Plus, explore ways to generate a Power BI report using a Fabric data lakehouse.

    More details


    User Reviews
    Rating
    0
    0
    0
    0
    0
    average 0
    Total votes0
    Focused display
    Category
    Gini von Courter
    Gini von Courter
    Instructor's Courses
    Training design and delivery for: Microsoft SharePoint, Dynamics 365 and the Power Platform (Power BI, PowerApps, and Power Automate), Outlook, Word, Teams, and a few other apps.
    LinkedIn Learning is an American online learning provider. It provides video courses taught by industry experts in software, creative, and business skills. It is a subsidiary of LinkedIn. All the courses on LinkedIn fall into four categories: Business, Creative, Technology and Certifications. It was founded in 1995 by Lynda Weinman as Lynda.com before being acquired by LinkedIn in 2015. Microsoft acquired LinkedIn in December 2016.
    • language english
    • Training sessions 23
    • duration 1:30:23
    • English subtitles has
    • Release Date 2023/11/18