Learn Reading Charts and Price Action in Any Trading Market
DBA Training
50:24
Description
Coupon : PRICEACTIONSEP Support Resistance , Trendline , Fibonacci , Candlestick Patterns , RSI Concept
What You'll Learn?
- Knowledge of Candlestick Patterns
- Understanding of how Market works
- Fibonacci Trading Strategy and Concept
- Price Action Support and Resistance
- RSI Concept
Who is this for?
What You Need to Know?
More details
DescriptionLearn Price Action in less than 1 hour : Support Resistance , Trendline , Fibonacci , Candlestick Patterns , RSI Concept
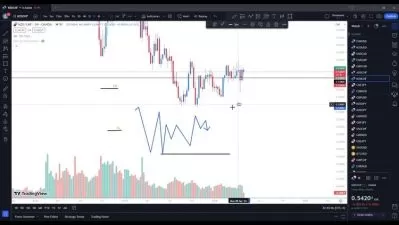
Support and resistance are two foundational concepts in technical analysis. Understanding what these terms mean and their practical application is essential to correctly reading price charts.
Prices move because of supply and demand. When demand is greater than supply, prices rise. When supply is greater than demand, prices fall. Sometimes, prices will move sideways as both supply and demand are in equilibrium.
Like many concepts in technical analysis, the explanation and rationale behind technical concepts are relatively easy
Fibonacci retracement is a method of technical analysis for determining support and resistance levels. It is named after the Fibonacci sequence of numbers, whose ratios provide price levels to which markets tend to retrace a portion of a move, before a trend continues in the original direction
Trendlines are easily recognizable lines that traders draw on charts to connect a series of prices together or show some data's best fit. The resulting line is then used to give the trader a good idea of the direction in which an investment's value might move.
Candlestick patterns are technical trading tools that have been used for centuries to predict price direction
Who this course is for:
- No prior knowledge is required. The course is equally useful to complete beginners and experienced traders.
Learn Price Action in less than 1 hour : Support Resistance , Trendline , Fibonacci , Candlestick Patterns , RSI Concept
Support and resistance are two foundational concepts in technical analysis. Understanding what these terms mean and their practical application is essential to correctly reading price charts.
Prices move because of supply and demand. When demand is greater than supply, prices rise. When supply is greater than demand, prices fall. Sometimes, prices will move sideways as both supply and demand are in equilibrium.
Like many concepts in technical analysis, the explanation and rationale behind technical concepts are relatively easy
Fibonacci retracement is a method of technical analysis for determining support and resistance levels. It is named after the Fibonacci sequence of numbers, whose ratios provide price levels to which markets tend to retrace a portion of a move, before a trend continues in the original direction
Trendlines are easily recognizable lines that traders draw on charts to connect a series of prices together or show some data's best fit. The resulting line is then used to give the trader a good idea of the direction in which an investment's value might move.
Candlestick patterns are technical trading tools that have been used for centuries to predict price direction
Who this course is for:
- No prior knowledge is required. The course is equally useful to complete beginners and experienced traders.
User Reviews
Rating

DBA Training
Instructor's Courses
Udemy
View courses Udemy- language english
- Training sessions 8
- duration 50:24
- Release Date 2024/10/05