Learn R Programming from Scratch
Harshit Srivastava
1:47:12
Description
For Data Analysis and Data Visualization
What You'll Learn?
- You could write an R script and R commands on console
- You could implement various concepts in R such as vectors, lists, loop, if else, etc
- You could create Data Visualization charts with plot- line, bar, scatterplot and pie chart
- You could perform various Statistical operations on dataset such as finding min, max, median, mode, etc
Who is this for?
What You Need to Know?
More details
DescriptionWelcome to this course on R programming, where you will learn to write code in R by implementing various concepts. As you might already be aware that R is not like general purpose programming languages, but optimized specifically to do complex mathematical tasks, finding insights from huge dataset and plotting the insights in form of Visualization charts. These capabilities make R, the most widely used language when it comes to Data Science, Data Analysis and Business Intelligence.
This course would teach you everything in R programming right from the scratch, so don't worry if you an absolute beginner. Moreover, if you have already used python or R previously, this course would take your skillset to the professional levels.
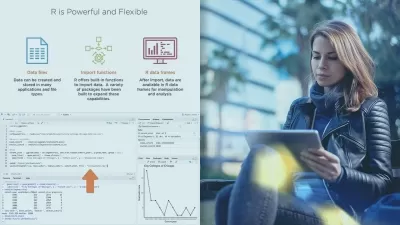
Why learn R?
It helps Data Analysts and Data Scientists perform many data-related tasks, such as data storage and data analysis, and can be used to create customized dashboards and data visualizations. R is a high level language that has easier syntax as compared to other programming languages such as C, C++, Java, python, dot net. If you are skilled in R programming, it will add a significant value on your Resume and could help you get an aspirational career opportunity.
Here in this course you would learn various concepts in R with practical examples such as-
Fundamentals of R
Datatypes and Variables
String functions
Boolean
Operators in R- Arithmetic, Assignment, Comparison, Logical, Miscellaneous
Control statements- if else, switch case, if else ladder and nested if
Loop- for, while, repeat, break, next, nested
Creating functions, parameters and arguments
Data Structures in R
Vector and List
Arrays and Matrix
Data Visualization in R- Plot
Line, Bar, Scatterplot, Pie charts, histogram
Statistics in R with mtcars
Statistical functions- max, min, mean, median, mode
Who this course is for:
- Anyone curious to learn R Programming
- People interested in performing Data Analysis and creating Visualization charts
Welcome to this course on R programming, where you will learn to write code in R by implementing various concepts. As you might already be aware that R is not like general purpose programming languages, but optimized specifically to do complex mathematical tasks, finding insights from huge dataset and plotting the insights in form of Visualization charts. These capabilities make R, the most widely used language when it comes to Data Science, Data Analysis and Business Intelligence.
This course would teach you everything in R programming right from the scratch, so don't worry if you an absolute beginner. Moreover, if you have already used python or R previously, this course would take your skillset to the professional levels.
Why learn R?
It helps Data Analysts and Data Scientists perform many data-related tasks, such as data storage and data analysis, and can be used to create customized dashboards and data visualizations. R is a high level language that has easier syntax as compared to other programming languages such as C, C++, Java, python, dot net. If you are skilled in R programming, it will add a significant value on your Resume and could help you get an aspirational career opportunity.
Here in this course you would learn various concepts in R with practical examples such as-
Fundamentals of R
Datatypes and Variables
String functions
Boolean
Operators in R- Arithmetic, Assignment, Comparison, Logical, Miscellaneous
Control statements- if else, switch case, if else ladder and nested if
Loop- for, while, repeat, break, next, nested
Creating functions, parameters and arguments
Data Structures in R
Vector and List
Arrays and Matrix
Data Visualization in R- Plot
Line, Bar, Scatterplot, Pie charts, histogram
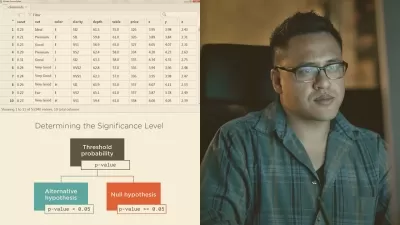
Statistics in R with mtcars
Statistical functions- max, min, mean, median, mode
Who this course is for:
- Anyone curious to learn R Programming
- People interested in performing Data Analysis and creating Visualization charts
User Reviews
Rating

Harshit Srivastava
Instructor's Courses
Udemy
View courses Udemy- language english
- Training sessions 20
- duration 1:47:12
- Release Date 2024/07/24