Google Data Studio - Create reports and data visualizations
Skill Tree
1:59:51
Description
Create custom Google Analytics Dashboards and turn analytical data into powerful informative reports.
What You'll Learn?
- How to connect Data Studio to Google Sheets
- Learn how to create calculated field
- Create powerful Scorecards to display key metrics and KPIs
- Create various types of charts to visualize you data
- Create time series chart to display data over a time period
- Create control filters to interact with your data.
- Create Add data range filters to control data displayed in your dashboards
- Share your Reports and Dashboards with other users
Who is this for?
More details
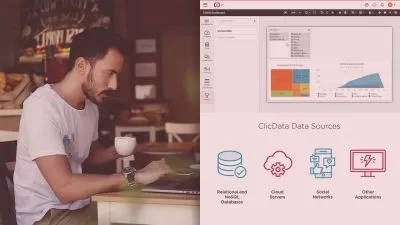
DescriptionGoogle Data Studio, is a free online tool for converting data into customizable informative reports and dashboards . Google Data Studio turns your data into informative reports and dashboards that are easy to read, easy to share and fully customisable. Google Data Studio is available free to people with a Google or Gmail account.
Google Data Studio enables to turn analytical data into powerful informative, easy-to-understand reports through data visualization. The reports are easy to read, easy to share and even customizable to each of your clients.
Google Data Studio works seamlessly with your Google Sheets data to create amazing data analysis in minutes.
Google Data Studio is an incredibly easy to use drag and drop tool that allows a multitude of different visualizations to be created in minutes. The addition of filtering tools produces stunning reports that will take your data analysis to the next level.
In this course we are going to teach you the following:
How to connect Data Studio to Google Sheets
Learn how to calculated field
Create powerful Scorecards to display key metrics and KPIs
Create various types of charts to visualize you data
Create time series chart to display data over a time period
Create control filters to interact with your data.
Create Add data range filters to control data displayed in your dashboards
Learn to share your Reports and Dashboards with other users
Who this course is for:
- Beginners to data analysis and visualization
- Beginners to Google Data Studio
Google Data Studio, is a free online tool for converting data into customizable informative reports and dashboards . Google Data Studio turns your data into informative reports and dashboards that are easy to read, easy to share and fully customisable. Google Data Studio is available free to people with a Google or Gmail account.
Google Data Studio enables to turn analytical data into powerful informative, easy-to-understand reports through data visualization. The reports are easy to read, easy to share and even customizable to each of your clients.
Google Data Studio works seamlessly with your Google Sheets data to create amazing data analysis in minutes.
Google Data Studio is an incredibly easy to use drag and drop tool that allows a multitude of different visualizations to be created in minutes. The addition of filtering tools produces stunning reports that will take your data analysis to the next level.
In this course we are going to teach you the following:
How to connect Data Studio to Google Sheets
Learn how to calculated field
Create powerful Scorecards to display key metrics and KPIs
Create various types of charts to visualize you data
Create time series chart to display data over a time period
Create control filters to interact with your data.
Create Add data range filters to control data displayed in your dashboards
Learn to share your Reports and Dashboards with other users
Who this course is for:
- Beginners to data analysis and visualization
- Beginners to Google Data Studio
User Reviews
Rating

Skill Tree
Instructor's Courses
Udemy
View courses Udemy- language english
- Training sessions 28
- duration 1:59:51
- Release Date 2022/12/06