From Boring Data to Beautiful Art: Matplotlib Visualisation
Harikrishna Natrajan
2:30:57
Description
The simplest course for Matplotlib with day-to-day examples and no corporate speak. Make your data beautiful.
What You'll Learn?
- Use matplotlib library for Python to create visualisations from numeric data
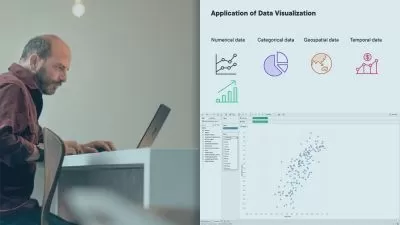
- Learn different types of charts: Bar, Line, Pie, Area, Histogram, Heat Map, Polygon, Contour, and more.
- Learn to prepare CSV data for use with matplotlib
- Learn how to plot using matplotlib on GUI-based desktops, and even on servers with no screens.
Who is this for?
What You Need to Know?
More details
DescriptionComputers can understand numbers, but humans cannot.
Humans can understand visualisation and patterns.
For humans to understand data, the data itself needs to speak to us and show us the way.
Use Python and matplotlib to create applications that turn reams of numbers into beautiful charts.
Find the meaning within the data.
Find the hidden patterns.
As the data speaks to you, you'll understand what to do next.
The cloud in your mind clears. The data shows the way ahead.
Take your goal forward and pave the way to success.
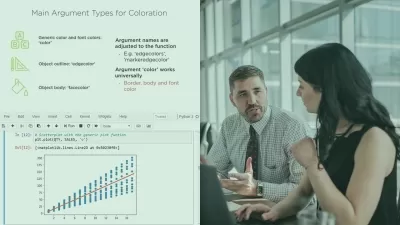
In this course, you'll learn how to write Python programs using matplotlib library.
Matplotlib gives us the functionality to turn our raw data into many, many different types of charts.
We'll also learn how to use Jupyter to see how our chart looks on the fly as we complete each line of code.
No more writing the entire code, and then getting disappointed if things don't work.
Get instant feedback from Python as soon as you write just one line of code.
The combination of Python, Matplotlib, Jupyter and Visual Studio Code makes it a snap to turn complex numeric data into beautiful visualisations within a few lines of code.
Stop crunching numbers in mind or on paper.
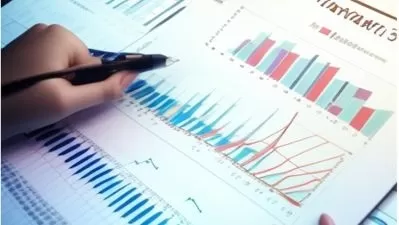
Turn them into charts that make the patterns immediately obvious.
Understand the data thoroughly and do what matters the most.
Also, I promise to use no complicated corporate examples.
You will learn how to plot charts for simple day-to-day activities such as watching a football match, going for a drive, visiting tourist places, buying apples, etc.
Who this course is for:
- Python programmers and data scientists who want to visualise their data to make it look beautiful and easier to understand
- Financial or Fintech professionals who know a little Python and want to know how to visualise their investment positions
Computers can understand numbers, but humans cannot.
Humans can understand visualisation and patterns.
For humans to understand data, the data itself needs to speak to us and show us the way.
Use Python and matplotlib to create applications that turn reams of numbers into beautiful charts.
Find the meaning within the data.
Find the hidden patterns.
As the data speaks to you, you'll understand what to do next.
The cloud in your mind clears. The data shows the way ahead.
Take your goal forward and pave the way to success.
In this course, you'll learn how to write Python programs using matplotlib library.
Matplotlib gives us the functionality to turn our raw data into many, many different types of charts.
We'll also learn how to use Jupyter to see how our chart looks on the fly as we complete each line of code.
No more writing the entire code, and then getting disappointed if things don't work.
Get instant feedback from Python as soon as you write just one line of code.
The combination of Python, Matplotlib, Jupyter and Visual Studio Code makes it a snap to turn complex numeric data into beautiful visualisations within a few lines of code.
Stop crunching numbers in mind or on paper.
Turn them into charts that make the patterns immediately obvious.
Understand the data thoroughly and do what matters the most.
Also, I promise to use no complicated corporate examples.
You will learn how to plot charts for simple day-to-day activities such as watching a football match, going for a drive, visiting tourist places, buying apples, etc.
Who this course is for:
- Python programmers and data scientists who want to visualise their data to make it look beautiful and easier to understand
- Financial or Fintech professionals who know a little Python and want to know how to visualise their investment positions
User Reviews
Rating

Harikrishna Natrajan
Instructor's Courses
Udemy
View courses Udemy- language english
- Training sessions 9
- duration 2:30:57
- English subtitles has
- Release Date 2023/12/16