Fire Hotspots Analysis using GIS
Bijaya Maharjan
2:23:00
Description
Spatial auto correlation and hotspots analysis
What You'll Learn?
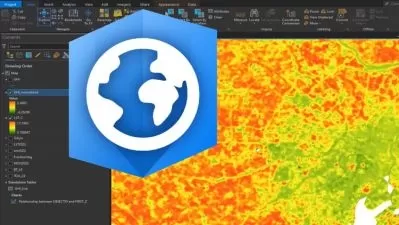
- Download of VIIRS-375m Active Fire Data from NASA's Fire Information for Resource Management System (FIRMS)
- To be familiar with Fire Hotspots Analysis (Getis-Ord Gi*)
- To be familiar with Spatial Autocorrelation and Moran’s I (Index)
- Generate of various distribution patterns, charts and graphs (Statistical Analysis)
Who is this for?
What You Need to Know?
More details
DescriptionThe course is designed for explore and download of VIIRS-375m Active Fire Data of specific study area. The Visible Infrared Imaging Radiometer Suite (VIIRS), which was produced by NASA's Fire Information for Resource Management System (FIRMS), is a recent developed moderate resolution sensor provides daily global active fire products at finer spatial resolution of 375m with strong fire sensitivity since 2012. So, the VIIRS-375m fire product have high capability to detect cooler and smaller fires. Further, using of Spatial Statistics Tools of ArcGIS, fire hotspots area were identified for the acquired active fire dataset. Hot spot analysis that performs to show where you have clusters and where you don’t have clusters in any data that you are working with. In other words, it finds places where values that are very different from the average, either really high or really low, cluster together spatially in a nonrandom way. The Hotspot analysis tool returns three levels of confidence ie 90%, 95% and 99% confident. A feature belongs to a nonrandom cluster of high values ie a hot spot or to a nonrandom cluster of low values ie a cold spot. In addition, Spatial autocorrelation helps to understand the degree to which one object is similar to other nearby objects. Moran’s I (Index) measures spatial autocorrelation. Positive spatial autocorrelation is when similar values cluster together in a map. Negative spatial autocorrelation is when dissimilar values cluster together in a map. Moran’s I can be classified as positive, negative, and no spatial auto-correlation. Positive spatial autocorrelation occurs when Moran’s I is close to +1. A value of 0 for Moran’s I typically indicates no autocorrelation. The statistical analysis such as preparation of chart, graph and pattern provides an addition information about the fire data distribution in space and time. The course is ended with the preparation of an informative and comprehensive fire hotspots map layout design. The proper compilation of each analyzed data into ArcGIS platform finally concluded into a better and informative map design and presentation. The process of map composition starts with preparation of appropriate layout for the map. Apart from the data, a map has certain other essential components that make map, a package of effective and clear communication.
Who this course is for:
- Civil Engineer
- Environmentalist
- Forestry
- Geologist
- Urban Planner
- Natural Resource Management
- Bio diversity
- Engineer
- GIS Enthusiastic
The course is designed for explore and download of VIIRS-375m Active Fire Data of specific study area. The Visible Infrared Imaging Radiometer Suite (VIIRS), which was produced by NASA's Fire Information for Resource Management System (FIRMS), is a recent developed moderate resolution sensor provides daily global active fire products at finer spatial resolution of 375m with strong fire sensitivity since 2012. So, the VIIRS-375m fire product have high capability to detect cooler and smaller fires. Further, using of Spatial Statistics Tools of ArcGIS, fire hotspots area were identified for the acquired active fire dataset. Hot spot analysis that performs to show where you have clusters and where you don’t have clusters in any data that you are working with. In other words, it finds places where values that are very different from the average, either really high or really low, cluster together spatially in a nonrandom way. The Hotspot analysis tool returns three levels of confidence ie 90%, 95% and 99% confident. A feature belongs to a nonrandom cluster of high values ie a hot spot or to a nonrandom cluster of low values ie a cold spot. In addition, Spatial autocorrelation helps to understand the degree to which one object is similar to other nearby objects. Moran’s I (Index) measures spatial autocorrelation. Positive spatial autocorrelation is when similar values cluster together in a map. Negative spatial autocorrelation is when dissimilar values cluster together in a map. Moran’s I can be classified as positive, negative, and no spatial auto-correlation. Positive spatial autocorrelation occurs when Moran’s I is close to +1. A value of 0 for Moran’s I typically indicates no autocorrelation. The statistical analysis such as preparation of chart, graph and pattern provides an addition information about the fire data distribution in space and time. The course is ended with the preparation of an informative and comprehensive fire hotspots map layout design. The proper compilation of each analyzed data into ArcGIS platform finally concluded into a better and informative map design and presentation. The process of map composition starts with preparation of appropriate layout for the map. Apart from the data, a map has certain other essential components that make map, a package of effective and clear communication.
Who this course is for:
- Civil Engineer
- Environmentalist
- Forestry
- Geologist
- Urban Planner
- Natural Resource Management
- Bio diversity
- Engineer
- GIS Enthusiastic
User Reviews
Rating

Bijaya Maharjan
Instructor's Courses
Udemy
View courses Udemy- language english
- Training sessions 5
- duration 2:23:00
- English subtitles has
- Release Date 2022/11/16