Financial Analytics with Power BI
FestMan Learning Hub, Thomas Festus Cudjoe
1:43:00
Description
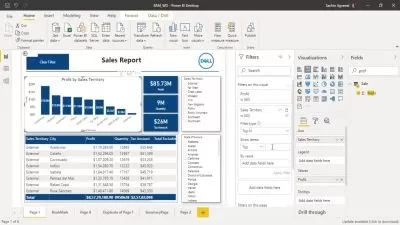
Design interactive financial analysis Dashboard with Microsoft Power BI.
What You'll Learn?
- Learn how to design interactive dashboard with Power BI.
- Learn how to perform time intelligence calculations using DAX.
- Learn how to share and consume Power BI reports.
- Learn how to apply conditional formatting in Power BI
Who is this for?
More details
DescriptionAre you considering a career in the Data space?
One of the ways to build your skills and your portfolio is to work on projects.
In this course, you will have the opportunity to expand your knowledge and skills in Power BI by learning how to design practical and interactive financial dashboards. This course covers the report development process in Power BI. We will start by connecting to data, cleaning, and transforming the Data. Then we will move on to Data modeling and DAX. Here you will learn how to analyze data using Data Analysis expressions. You will also learn how to perform time-based calculations such as Year Over Year change etc. using Time intelligence functions in Power BI. Finally, you will learn to visualize your data to design interactive reports in Power BI.
By the end of this guided project, you’ll be extremely comfortable building reports and dashboards in Power BI.
Key learning outcomes:
· Data cleaning and modelling
· Data analysis with DAX
· Time intelligence
· Conditional formatting
· Data visualization
· Reporting development
What our Students are saying
All concepts are carefully explained and illustrated. I enjoy every bit of the training. Thank you to all the Festman team. Brilliant Course.
~Folorunso Adebare Lala
The course is easy to understand and the instructor explains the content quite well. The content is plentiful and great in a well put project.
~Octavio
Who this course is for:
- Power BI Beginers
- Finance professionals who want to learn how to design reports and dashboards with Power BI
- Data analyst who want to develop practical skills in Power BI
Are you considering a career in the Data space?
One of the ways to build your skills and your portfolio is to work on projects.
In this course, you will have the opportunity to expand your knowledge and skills in Power BI by learning how to design practical and interactive financial dashboards. This course covers the report development process in Power BI. We will start by connecting to data, cleaning, and transforming the Data. Then we will move on to Data modeling and DAX. Here you will learn how to analyze data using Data Analysis expressions. You will also learn how to perform time-based calculations such as Year Over Year change etc. using Time intelligence functions in Power BI. Finally, you will learn to visualize your data to design interactive reports in Power BI.
By the end of this guided project, you’ll be extremely comfortable building reports and dashboards in Power BI.
Key learning outcomes:
· Data cleaning and modelling
· Data analysis with DAX
· Time intelligence
· Conditional formatting
· Data visualization
· Reporting development
What our Students are saying
All concepts are carefully explained and illustrated. I enjoy every bit of the training. Thank you to all the Festman team. Brilliant Course.
~Folorunso Adebare Lala
The course is easy to understand and the instructor explains the content quite well. The content is plentiful and great in a well put project.
~Octavio
Who this course is for:
- Power BI Beginers
- Finance professionals who want to learn how to design reports and dashboards with Power BI
- Data analyst who want to develop practical skills in Power BI
User Reviews
Rating

FestMan Learning Hub, Thomas Festus Cudjoe
Instructor's Courses
Udemy
View courses Udemy- language english
- Training sessions 16
- duration 1:43:00
- Release Date 2023/03/07