Companies Home Search Profile

Exploring Data with Quantitative Techniques Using R

Focused View

Martin Burger

2:02:02

23 View
  • 01 - Course Overview.mp4
    01:47
  • 02 - Introduction.mp4
    01:18
  • 03 - Managing Expectations.mp4
    03:14
  • 04 - Course Dataset.mp4
    06:25
  • 05 - Data Summary.mp4
    06:35
  • 06 - Research Questions.mp4
    03:20
  • 07 - Summary.mp4
    01:13
  • 08 - Introduction.mp4
    01:32
  • 09 - Using Random Generators for Sampling.mp4
    05:00
  • 10 - Reproducing Pseudo-random Processes.mp4
    05:57
  • 11 - Sampling a Table with R Base .mp4
    03:52
  • 12 - Sampling a Table with Dplyr.mp4
    07:25
  • 13 - Summary.mp4
    01:49
  • 14 - Introduction.mp4
    01:52
  • 15 - Count Based Summaries.mp4
    04:14
  • 16 - Grouped Multivariate Counts.mp4
    04:27
  • 17 - Distributions of Numeric Variables.mp4
    08:54
  • 18 - Combined Plot Series.mp4
    03:48
  • 19 - Times Series Based Summaries.mp4
    06:38
  • 20 - Visualizing Aggregated Data.mp4
    07:46
  • 21 - Summary.mp4
    01:39
  • 22 - Introduction.mp4
    01:41
  • 23 - Correlations in Numeric Variables.mp4
    04:21
  • 24 - Odds Ratio.mp4
    04:32
  • 25 - Logistic Regression for Binary Outcome Variable.mp4
    08:10
  • 26 - Visualizing the Traffic between the Airports.mp4
    08:31
  • 27 - Course Summary.mp4
    06:02
  • Description


    Data exploration is one of the first things you do when analyzing data. It leads the way to further in depth analysis. With this course, you will learn how to use R for data exploration of a large dataset.

    What You'll Learn?


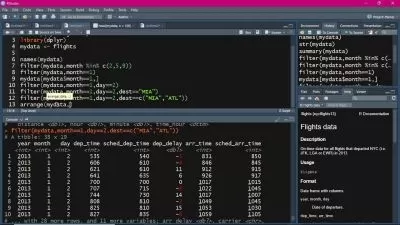
      Do you want to perform data exploration on a large dataset? In this course, Exploring Data with Quantitative Techniques Using R, you will see why R is a great tool in getting to know your data. The course uses a 3 step approach to explore the NYC flights dataset. First, you will get an initial idea via summary statistics. Then, you will use hypothesis tests and visualizations to work on single variables. Finally, you will use techniques for correlations between multiple variables. On top of that, the course also has a module on data sampling which is especially useful for large datasets. When you are finished with this course, you will have the skills and knowledge of data exploration needed to understand a new dataset. You will also use some outstanding add-on packages for the topic.

    More details


    User Reviews
    Rating
    0
    0
    0
    0
    0
    average 0
    Total votes0
    Focused display
    Martin Burger
    Martin Burger
    Instructor's Courses
    Martin studied biostatistics and worked for several pharmaceutical companies before he became a data science consultant and author. He published over 15 courses on R, Tableau 9 and other data science related subjects. His main focus lies on analytics software like R and SPSS but he is also interested in modern data visualization tools like Tableau. If he is not busy coding, blogging or working out new teaching concepts you may find him skiing or hiking in the Alps.
    Pluralsight, LLC is an American privately held online education company that offers a variety of video training courses for software developers, IT administrators, and creative professionals through its website. Founded in 2004 by Aaron Skonnard, Keith Brown, Fritz Onion, and Bill Williams, the company has its headquarters in Farmington, Utah. As of July 2018, it uses more than 1,400 subject-matter experts as authors, and offers more than 7,000 courses in its catalog. Since first moving its courses online in 2007, the company has expanded, developing a full enterprise platform, and adding skills assessment modules.
    • language english
    • Training sessions 27
    • duration 2:02:02
    • level average
    • Release Date 2023/12/05