Excel Masterclass: A-Z Data Analysis Statistics & Dashboard
Shahriar's Sight Academy
7:26:04
Description
Learn Excel with Important Formulas-Functions, PivotTables, Analysis Tools, Graphs and Dashboard for A-Z Data Analysis.
What You'll Learn?
- You will learn to clean and format data, including removing duplicates, handling missing data, and managing outliers to ensure data integrity.
- You will learn advanced techniques for sorting and filtering data to efficiently extract relevant insights from large datasets.
- You will learn how to apply conditional formatting in Excel to visually highlight key trends, insights, and anomalies within your data.
- You will learn essential Excel formulas and functions such as SUM, AVERAGE, COUNT, IF statements and MORE, enabling you to manipulate data effectively.
- You will learn to utilize Excel's lookup functions (VLOOKUP, HLOOKUP, XLOOKUP) to efficiently search for and retrieve specific information within datasets.
- You will learn various graph and chart types in Excel for data visualization, including bar charts, pie charts, scatter plots, and more to communicate insights.
- You will learn advanced analysis using PivotTables and PivotCharts, enabling you to analyze, and visualize complex datasets with ease and interactivity.
- You will learn to use Excel's built-in data analysis tools for statistical analysis, i.e., descriptive statistics, t-tests, ANOVA, correlation, and regression.
- You will learn to design and create dynamic DASHBOARD in Excel, by a visually interactive format for effective decision-making and reporting.
- You will learn best practices for enhancing your Excel dashboard, including layout optimization, graphical elements, etc., to maximize impact and usability.
Who is this for?
What You Need to Know?
More details
DescriptionUnlock the power of data analysis with Excel in this comprehensive course designed to take you from novice to proficient data analyst. Whether you're new to Excel or looking to expand your skills, this course equips you with the essential tools and techniques to excel in data analysis.
Throughout the course, you'll dive deep into data cleaning and formatting, learning how to remove duplicates, handle missing data, and manage outliers effectively. You'll discover advanced sorting and filtering methods to extract valuable insights from complex datasets, and you'll master conditional formatting to visually highlight trends and anomalies.
With a focus on practicality, you'll gain proficiency in essential Excel formulas and functions for calculations, date manipulation, and conditional operations. You'll also harness the power of lookup functions to quickly retrieve specific information, streamlining your analysis workflow.
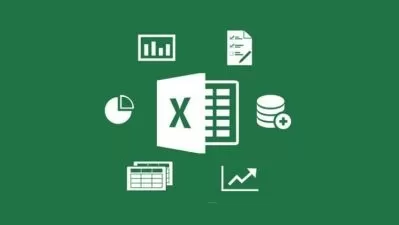
Data visualization is a key component of effective analysis, and you'll learn to create a variety of graphs and charts in Excel to communicate insights with clarity. From bar charts to scatter plots, you'll explore different visualization techniques to enhance data interpretation and presentation.
PivotTables and PivotCharts offer dynamic ways to summarize and analyze data, and you'll learn how to leverage these tools for advanced analysis and visualization. Additionally, you'll delve into Excel's statistical analysis tools, performing tasks such as descriptive statistics, t-tests, correlation, and regression analysis.
As you progress, you'll bring your newfound skills together to create dynamic dashboards in Excel, consolidating information into visually appealing and interactive formats for effective decision-making and reporting. You'll refine your dashboard with layout optimization and graphical elements, ensuring maximum impact and usability.
By the end of this course, you'll emerge as a proficient Excel user, equipped with the knowledge and skills to tackle data analysis challenges confidently and efficiently. Whether you're a professional seeking to enhance your career prospects or a student aiming to develop practical Excel expertise, this course empowers you to master data analysis from zero to hero.
Who this course is for:
- Individuals aiming to develop comprehensive knowledge in data cleaning, analysis, visualization, and dashboard creation in Excel.
- Beginners interested in learning practical Excel techniques for efficient data manipulation, visualization, and interpretation.
- Professionals seeking to enhance their data analysis skills within the familiar environment of Microsoft Excel.
Unlock the power of data analysis with Excel in this comprehensive course designed to take you from novice to proficient data analyst. Whether you're new to Excel or looking to expand your skills, this course equips you with the essential tools and techniques to excel in data analysis.
Throughout the course, you'll dive deep into data cleaning and formatting, learning how to remove duplicates, handle missing data, and manage outliers effectively. You'll discover advanced sorting and filtering methods to extract valuable insights from complex datasets, and you'll master conditional formatting to visually highlight trends and anomalies.
With a focus on practicality, you'll gain proficiency in essential Excel formulas and functions for calculations, date manipulation, and conditional operations. You'll also harness the power of lookup functions to quickly retrieve specific information, streamlining your analysis workflow.
Data visualization is a key component of effective analysis, and you'll learn to create a variety of graphs and charts in Excel to communicate insights with clarity. From bar charts to scatter plots, you'll explore different visualization techniques to enhance data interpretation and presentation.
PivotTables and PivotCharts offer dynamic ways to summarize and analyze data, and you'll learn how to leverage these tools for advanced analysis and visualization. Additionally, you'll delve into Excel's statistical analysis tools, performing tasks such as descriptive statistics, t-tests, correlation, and regression analysis.
As you progress, you'll bring your newfound skills together to create dynamic dashboards in Excel, consolidating information into visually appealing and interactive formats for effective decision-making and reporting. You'll refine your dashboard with layout optimization and graphical elements, ensuring maximum impact and usability.
By the end of this course, you'll emerge as a proficient Excel user, equipped with the knowledge and skills to tackle data analysis challenges confidently and efficiently. Whether you're a professional seeking to enhance your career prospects or a student aiming to develop practical Excel expertise, this course empowers you to master data analysis from zero to hero.
Who this course is for:
- Individuals aiming to develop comprehensive knowledge in data cleaning, analysis, visualization, and dashboard creation in Excel.
- Beginners interested in learning practical Excel techniques for efficient data manipulation, visualization, and interpretation.
- Professionals seeking to enhance their data analysis skills within the familiar environment of Microsoft Excel.
User Reviews
Rating

Shahriar's Sight Academy
Instructor's Courses
Udemy
View courses Udemy- language english
- Training sessions 60
- duration 7:26:04
- English subtitles has
- Release Date 2024/05/18