Companies Home Search Profile

Excel in Microsoft Excel 3: Pivot Tables Intro & Masterclass

Focused View

Phillip Burton,I Do Data Limited

5:53:33

115 View
  • 1 - Welcome.mp4
    01:33
  • 2 - Welcome to Udemy.html
  • 3 - Curriculum.mp4
    03:59
  • 4 - Do you want autotranslated subtitles in more languages.html
  • 5 - Introduction to Udemy.mp4
    02:00
  • 6 - Our first PivotTable.mp4
    07:47
  • 6 - PivotTablesStart.xlsx
  • 7 - PivotTable Menus.mp4
    02:35
  • 8 - Our first PivotChart.mp4
    05:35
  • 9 - PivotChart Menus and An Introduction to Practice Activity 1.mp4
    03:13
  • 10 - Practice Activity Number 1.html
  • 11 - Answer to Practice Activity 1.mp4
    04:29
  • 12 - Source data requirements.mp4
    04:30
  • 13 - Adding additional values.mp4
    05:01
  • 14 - Recommended PivotTables.mp4
    03:30
  • 15 - Moving PivotTable.mp4
    03:22
  • 16 - Refresh PivotTable why it doesnt autoupdate.mp4
    06:21
  • 17 - Extracting data.mp4
    05:03
  • 18 - Sorting.mp4
    03:31
  • 19 - Practice Activity Number 2.html
  • 20 - Answer to Practice Activity 2.mp4
    01:51
  • 21 - Adding additional row fields.mp4
    02:28
  • 22 - Different layouts - Compact Outline and Tabular.mp4
    06:38
  • 23 - Blank Rows.mp4
    03:05
  • 24 - Group Records.mp4
    04:43
  • 25 - Showing or hiding additional detail the buttons.mp4
    04:17
  • 26 - Adding columns.mp4
    05:05
  • 27 - Adding page fields.mp4
    02:50
  • 28 - Adding filters.mp4
    09:35
  • 29 - Changing source.mp4
    03:55
  • 30 - Using a table source.mp4
    04:07
  • 31 - Final options.mp4
    03:43
  • 32 - Introduction to Practice Activity 3.mp4
    02:07
  • 33 - Practice Activity Number 3.html
  • 34 - Answers to Practice Activity 3.mp4
    04:12
  • 35 - Change aggregate COUNT MIN MAX.mp4
    08:26
  • 36 - Repeat All.mp4
    05:35
  • 37 - Using Conditional Formatting to hide Repeat All.mp4
    03:43
  • 38 - Grand Totals.mp4
    04:54
  • 39 - Adding subtotals.mp4
    09:07
  • 40 - Show items with no data.mp4
    05:38
  • 41 - Other field settings.mp4
    05:01
  • 42 - Practice Activity Number 4.html
  • 43 - Answers to Practice Activity 4.mp4
    02:18
  • 44 - Layout.mp4
    09:13
  • 45 - Totals & Filters and Alt Text.mp4
    04:40
  • 46 - Display.mp4
    03:35
  • 47 - Print.mp4
    04:52
  • 48 - Data.mp4
    11:24
  • 49 - Practice Activity Number 5.html
  • 50 - Answers to Practice Activity 5.mp4
    02:09
  • 51 - Create slicers.mp4
    03:08
  • 52 - Identifying impossible options and selecting more than one option at once.mp4
    04:59
  • 53 - Join to multiple PivotTables.mp4
    05:45
  • 54 - Options.mp4
    04:57
  • 55 - Practice Activity Number 6.html
  • 56 - Answer to Practice Activity 6.mp4
    03:35
  • 57 - Aggregates.mp4
    04:13
  • 58 - Group by time period.mp4
    05:39
  • 59 - Timelines.mp4
    06:16
  • 60 - Practice Activity Number 7.html
  • 61 - Answer to Practice Activity 7.mp4
    03:50
  • 62 - Formatting number values.mp4
    03:58
  • 63 - Custom Formatting number formatting.mp4
    11:45
  • 64 - Custom Formatting dates and text.mp4
    09:06
  • 65 - CustomFormatting.pdf
  • 65 - Custom Formatting sections and colors.mp4
    08:26
  • 66 - Conditional Formatting Highlighting cells.mp4
    05:32
  • 67 - Conditional Formatting Data Bars and Color Sets.mp4
    06:32
  • 68 - Formatting printing.mp4
    04:48
  • 69 - PivotTableFormatting170416.pdf
  • 69 - Styles.mp4
    04:09
  • 70 - Practice Activity Number 8.html
  • 71 - Answer to Practice Activity 8.mp4
    03:41
  • 72 - Percentage of total.mp4
    07:59
  • 73 - Percentage of total Advanced.mp4
    06:02
  • 74 - Cumulative totals.mp4
    05:20
  • 75 - Index.mp4
    04:49
  • 76 - Difference from.mp4
    03:11
  • 77 - Calculated fields.mp4
    04:10
  • 78 - Calculated Items.mp4
    05:43
  • 79 - Relationship of PivotChart with PivotTable.mp4
    02:34
  • 80 - Options and Styles.mp4
    02:54
  • 81 - Bubble charts.mp4
    04:10
  • 82 - Thank you for joining me.mp4
    01:20
  • 83 - Bonus Lecture.mp4
    03:22
  • Description


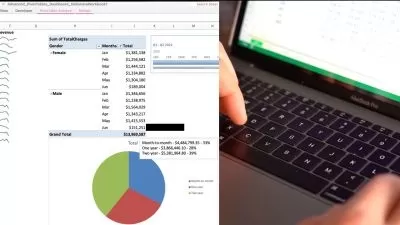
    Create data analysis in Excel using Pivot Tables with just a few clicks, together with summary Pivot Charts. Exam 70-779

    What You'll Learn?


    • Create Pivot Tables with a just a few clicks, simply and quickly.
    • Maintain and expand Pivot Tables.
    • Update data sources, and maintain formatting during refreshes.
    • Create Pivot Charts in a few simple clicks.
    • Know and use about the more advanced features, and create advanced Pivot Tables.
    • Find out how much powerful it is, and how quickly it can improve your data analysis.

    Who is this for?


  • This is for you if you have ever heard of the "Pivot Table", but didn't know what it is or how to use it.
  • This is also for you if you use PivotTables, and want to go deeper. Much deeper. :-)
  • We'll also go into the more advanced functions, and create charts as well, quickly and easily.
  • What You Need to Know?


  • You should be able to open and save Microsoft spreadsheets. You should also be able to enter data.
  • That's it! We'll create our first Pivot Table in just a couple of minutes - that's all.
  • More details


    Description

    Review:

    "The knowledge of the teacher is impressive, and he knows how to teach. The speed of the course is just right. And going thru the exercises after each one is great. I only have one word for the teacher and the way he's presenting the course WOW!!!" -- Daniel Sandberg

    This course covers one of the most useful, but scariest-sounding, functions in Microsoft Excel; PIVOT TABLES.

    It sounds difficult, but in fact can be done in just a few clicks. We'll do our first one in a couple of minutes - that's all it takes. We'll also add a chart as well in that time.

    After only these first few minutes, you will be streets ahead of anyone who doesn't know anything about Pivot Tables - it is really that important.

    After this introduction, we'll go into some detail into how to set up your Pivot Table - the initial data, and the various options that are available to you. We will go into advanced options that most people don't even know about, but which are very useful.

    By the end, you will be an Expert user of Pivot Tables, able to create reliable analyses which are able to be drilled-down quickly, and you'll be able to help others with their data analysis.

    Who this course is for:

    • This is for you if you have ever heard of the "Pivot Table", but didn't know what it is or how to use it.
    • This is also for you if you use PivotTables, and want to go deeper. Much deeper. :-)
    • We'll also go into the more advanced functions, and create charts as well, quickly and easily.

    User Reviews
    Rating
    0
    0
    0
    0
    0
    average 0
    Total votes0
    Focused display
    Category
    Phillip Burton
    Phillip Burton
    Instructor's Courses
    Hi. I'm Phillip, and I'm proud to Teach with Udemy as a Udemy Instructor Partner. I have been teaching on Udemy since 2015, and I have over 500,000 students and more than 40 video courses, including over a dozen Bestseller courses.My courses include Power BI, Tableau, SQL Server, Power Platform (Power Apps, Power Automate, etc.), Azure, Microsoft Office, and more. Many of my courses follow requirements for official Microsoft certifications - so with a bit of practice, you could enter the exam and put it on your CV or resume.I have been a Computing Consultant providing expert services in the development of computer systems and data analysis. I am one of 9 award winning Experts for Experts Exchange's 11th Annual Expert Awards. My interests are working with data, including Microsoft Power BI, Excel, Access, SQL Server, and the Power Platform.
    I Do Data Limited
    I Do Data Limited
    Instructor's Courses
    I Do Data is dedicated to creating video courses on Udemy in a variety of computer-related topics, such as SQL in its different dialects and Microsoft Office.Are you wanting to learn a new skill from the beginning? Or are you wanting to build on an existing skill? In either case, welcome.Our courses are available on Udemy at any time, so you can watch them whenever you like, as often as you like.For many of our courses, if you master the skills taught, you are able (if you wish) to take (and hopefully pass) the official certification offered by Microsoft, Tableau or other companies. That would look good on your CV or resume? It could make the difference between getting a promotion, or a more rewarding job. I Do Data courses are dedicated to enabling you to succeed.
    Students take courses primarily to improve job-related skills.Some courses generate credit toward technical certification. Udemy has made a special effort to attract corporate trainers seeking to create coursework for employees of their company.
    • language english
    • Training sessions 73
    • duration 5:53:33
    • Release Date 2022/11/27