Companies Home Search Profile

Excel and PowerPoint: Creating High-Impact Financial Presentations

Focused View

Danielle Stein Fairhurst

2:06:39

29 View
  • 01 - Creating compelling finance presentations.mp4
    00:49
  • 02 - What to know before starting.mp4
    01:48
  • 01 - How financial and nonfinancial data differs in Excel.mp4
    02:01
  • 02 - Communicating finance concepts to your audience.mp4
    02:17
  • 03 - Tools for preparing and presenting financial data.mp4
    01:12
  • 04 - Choosing between Excel and PowerPoint for presentations.mp4
    03:48
  • 05 - Choosing a chart or a table.mp4
    02:21
  • 06 - Selecting the right chart to communicate your message.mp4
    04:03
  • 01 - Charting with tables.mp4
    02:08
  • 02 - Summarizing data with PivotTables.mp4
    03:18
  • 03 - Charting with Pivots.mp4
    02:15
  • 04 - Cleaning up data with Power Query.mp4
    03:08
  • 05 - Manipulating data with unpivot in Power Query.mp4
    03:46
  • 01 - Building charts based on formulas vs. PivotCharts.mp4
    03:28
  • 02 - Making charts dynamic with dynamic arrays and named ranges.mp4
    03:59
  • 03 - Slicing and filtering data for presentations.mp4
    04:49
  • 04 - Deciding between formulas and PivotCharts.mp4
    01:46
  • 01 - Comparing data with a combo chart on two axes.mp4
    02:39
  • 02 - Show changes over time with a waterfall chart.mp4
    02:19
  • 03 - Tracking progress with a Gantt chart.mp4
    05:37
  • 04 - Showing data distribution with a histogram.mp4
    04:40
  • 05 - Displaying model sensitivities with a tornado chart.mp4
    03:36
  • 01 - Illustrating trends with sparklines.mp4
    01:29
  • 02 - Mapping geospatial data.mp4
    02:53
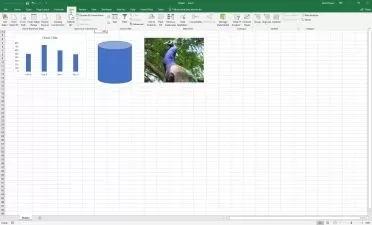
  • 03 - Adding images and icons in Excel.mp4
    03:20
  • 04 - Adding emojis in Excel.mp4
    02:03
  • 01 - Adding meaning to tables with color scales.mp4
    03:04
  • 02 - Finding and drawing attention to anomalies.mp4
    05:06
  • 03 - Giving numbers meaning with data bars.mp4
    02:07
  • 04 - Creating a heatmap with color scales.mp4
    02:32
  • 05 - Creating an actual vs. budget variance report.mp4
    04:07
  • 01 - Applying Office themes in PowerPoint.mp4
    03:37
  • 02 - Options for copying and pasting from Excel.mp4
    04:37
  • 03 - Linking and embedding visuals from Excel.mp4
    03:30
  • 04 - Creating charts and tables natively in PowerPoint.mp4
    03:45
  • 05 - Adding a Power BI report into PowerPoint.mp4
    01:17
  • 01 - Pasting Excel content into PowerPoint.mp4
    07:10
  • 02 - Using the PowerPoint Designer.mp4
    01:22
  • 03 - Animating a chart.mp4
    02:20
  • 04 - Animating a table.mp4
    02:39
  • 05 - Sharing your finalized presentation.mp4
    02:28
  • 01 - Next steps.mp4
    01:26
  • Description


    Find out how you can create high-impact, data-rich financial presentations using Excel and PowerPoint. In this course, Microsoft MVP and Financial Modelling Specialist Danielle Stein Fairhurst guides you through creating financial presentations that are compelling, easy to understand, and—best of all—easy to update. Get started with an example spreadsheet featuring typical finance data. Learn how to use conditional formatting to highlight important information, PivotTables to summarize data, and sparklines and charts to create illustrations. Explore several different methods—including copying and pasting, linking, and embedding—to import your work into PowerPoint. Plus, learn how to use PowerPoint animation features to animate Excel charts and tables and focus the viewer's attention.

    More details


    User Reviews
    Rating
    0
    0
    0
    0
    0
    average 0
    Total votes0
    Focused display
    Category
    Danielle Stein Fairhurst
    Danielle Stein Fairhurst
    Instructor's Courses
    Danielle Stein Fairhurst is regularly engaged as a speaker, course facilitator, financial modelling consultant and analyst. She founded the Financial Modellers’ Meetup groups (which currently meet virtually) and she is the author of “Using Excel for Business and Financial Modelling” Third Edition and “Financial Modeling in Excel For Dummies”. With many years of experience, a talent for financial modelling and professional approach, she helps her clients create meaningful financial models in the form of business cases, pricing models and management reports. She runs regular training seminars around Australia and globally, and her custom-built training courses have been described by attendees as well-presented, neatly structured, informative, practical, and extremely relevant to their everyday needs. She is available for presentations, workshops, training courses, lectures and seminars. Topics include Financial Modelling using Excel, Budgeting & Forecasting and Data Analysis & Reporting. She holds a Master of Business Administration (MBA) from Macquarie Graduate School of Management, and has taught management accounting subjects at Sydney University. She is on the judging panel for the 2020 Financial Modelling Innovation Awards, the Advisory Board of the Financial Modeling Institute (FMI) and was on the Diversity Council for the ModelOff Financial Modeling World Championships. Specialisations: Financial modelling / Budgeting and Forecasting / Business cases and pricing models / Data Analysis / Activity Based Costing / Management Reporting
    LinkedIn Learning is an American online learning provider. It provides video courses taught by industry experts in software, creative, and business skills. It is a subsidiary of LinkedIn. All the courses on LinkedIn fall into four categories: Business, Creative, Technology and Certifications. It was founded in 1995 by Lynda Weinman as Lynda.com before being acquired by LinkedIn in 2015. Microsoft acquired LinkedIn in December 2016.
    • language english
    • Training sessions 42
    • duration 2:06:39
    • English subtitles has
    • Release Date 2024/08/12