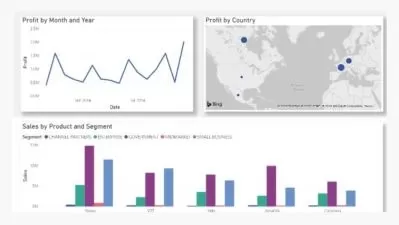
Excel and PowerBi for Data Visualization
Information SystemSchool
2:46:06
Description
Data Visualization with Microsoft Excel and PowerBi
What You'll Learn?
- Excel and PowerBi for Data Visualization
- Data analysis with Excel
- Data visualization with PowerBi
- Hands on experience with Excel and PowerBi
Who is this for?
More details
DescriptionMicrosoft Excel is a spreadsheet developed by Microsoft for Windows, macOS, Android and iOS. It features calculation or computation capabilities, graphing tools, pivot tables, and a macro programming language called Visual Basic for Applications. Excel forms part of the Microsoft Office suite of software. Power BI is an interactive data visualization software product developed by Microsoft with a primary focus on business intelligence. It is part of the Microsoft Power Platform. We are covering Excel fundamentals, Quick Access Toolbar, Basic excel functions such as SUM, MIN & MAX, Average & AutoSum. Excel sheet modifications using Moving & Copying data, Inserting & deleting rows, Hiding, unhiding and re-naming. Formatting data, Font formatting, Creating styles, Conditional formatting, Creating Charts, Excel column chart, Adding and modifying data, Excel Pie chart. Pivot Table, Creating a Pivot table, Modifying pivot table, Grouping pivot table, Creating pivot charts, Filtering pivot charts, Excel conditional functions, IF function, Nesting function. Lookup functions VLookup, HLookup, INDEX & MATCH. For PowerBi we go through Power BI , Introduction to PowerBI desktop, Connecting to Data, Table relationships, Data model, Filter Flow, Data Analysis Expressions (DAX) – Calculated Columns, Data Analysis Expressions (DAX) – Measures, IF, AND, OR, CALCULATE , CALCULATE ALL, SUMX, Report View in PowerBI, Inserting Charts, Formatting, Filtering options, Matrix Visuals, Treemaps, Trend lines and forecast, Managing roles in Power BI
Publishing to PowerBI service.
Who this course is for:
- Anyone interested in data visualization
Microsoft Excel is a spreadsheet developed by Microsoft for Windows, macOS, Android and iOS. It features calculation or computation capabilities, graphing tools, pivot tables, and a macro programming language called Visual Basic for Applications. Excel forms part of the Microsoft Office suite of software. Power BI is an interactive data visualization software product developed by Microsoft with a primary focus on business intelligence. It is part of the Microsoft Power Platform. We are covering Excel fundamentals, Quick Access Toolbar, Basic excel functions such as SUM, MIN & MAX, Average & AutoSum. Excel sheet modifications using Moving & Copying data, Inserting & deleting rows, Hiding, unhiding and re-naming. Formatting data, Font formatting, Creating styles, Conditional formatting, Creating Charts, Excel column chart, Adding and modifying data, Excel Pie chart. Pivot Table, Creating a Pivot table, Modifying pivot table, Grouping pivot table, Creating pivot charts, Filtering pivot charts, Excel conditional functions, IF function, Nesting function. Lookup functions VLookup, HLookup, INDEX & MATCH. For PowerBi we go through Power BI , Introduction to PowerBI desktop, Connecting to Data, Table relationships, Data model, Filter Flow, Data Analysis Expressions (DAX) – Calculated Columns, Data Analysis Expressions (DAX) – Measures, IF, AND, OR, CALCULATE , CALCULATE ALL, SUMX, Report View in PowerBI, Inserting Charts, Formatting, Filtering options, Matrix Visuals, Treemaps, Trend lines and forecast, Managing roles in Power BI
Publishing to PowerBI service.
Who this course is for:
- Anyone interested in data visualization
User Reviews
Rating
Information SystemSchool
Instructor's Courses
Udemy
View courses Udemy- language english
- Training sessions 34
- duration 2:46:06
- Release Date 2022/12/14


