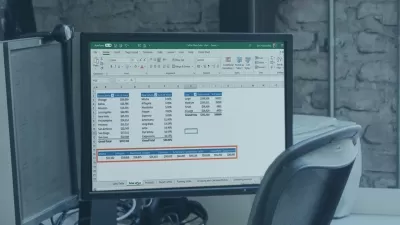
Excel: Advanced PivotTable Techniques for Creating a Cohesive Dashboard
Al Chen
1:10:56
Description
Learn advanced PivotTable techniques to create a dynamic and automated dashboard in Excel!
PivotTables are more than just tools for analyzing your dataset. You can use PivotTables to create charts that update dynamically when your raw data updates. This class is all about creating an integrated dashboard with PivotCharts, Sparklines, and more. The best part is that your dashboard can update automatically if set up correctly with PivotTables.
Alongside Al, you'll learn how to:
- Create a variety of visualizations like Sparklines, Data Bars, and Map charts
- Organize your charts on a dashboard
- Add Slicers to make it easy for your teammates to filter the data shown on the dashboard
- Connect PivotTables to your dashboard to make updating your dashboard a breeze
Set up your dashboard with PivotTables, Slicers, and more so that your teammates can interact with your dashboard easily. You'll also save time by automating your dashboard which prevents manual updates. You'll be actively using the Excel workbook I created for this class (see Projects & Resources).

Who is this class for?
Advanced Excel users, but all students are encouraged to participate and enjoy.
Prerequisites:
This class moves fast. You should have a basic understanding of Excel including:
- Navigating around Excel
- Writing basic formulas (including VLOOKUP)
- Creating basic charts
- Creating PivotTables
Some classes to consider taking as a prerequisite:
- Excel PivotTables: Advanced PivotTable Techniques for Analyzing and Presenting Data Faster
- Intermediate Excel for the Real World: Cleaning Data for Analysis and Forecasting
Software
I’ll be using Mac Excel 2016 for Office 365. You can use any of the following versions of Excel for this class:
- Windows: Excel 2019, Excel 2016, Excel 2013
- Mac: Excel 2016, Excel 2011
What You'll Learn?
- Business
- Data Visualization
- Pivot Tables
- Big Data
- Productivity
- Microsoft Excel
- Business Analysis
More details
User Reviews
Rating
Al Chen
Instructor's CoursesI have been an Excel power user for 10+ years. I started learning Excel when I was a financial analyst at Google. 50,000+ students have taken my online Excel classes and I have facilitated in-person workshops to over 5,000 MBA students around the the U.S.
I founded KeyCuts, an Excel training and consulting company to Fortune 500 companies. If it isn't clear I'm addicted to Excel, perhaps my podcast about Excel and data analysis (Dear Analyst) will convince you :).
Outside of Excel and spreadsheets, I work full-time at Coda, an all-in-one doc for teams. If you would like to read my full journey with spreadsheets and Coda, check out this blog post.
Feel free connect with me on LinkedIn and ask me any questions about Excel, Coda, or data analysis! You can also find me on Instagram, TikTok, and Quora.

SkillShare
View courses SkillShare- language english
- Training sessions 11
- duration 1:10:56
- English subtitles has
- Release Date 2023/02/15


