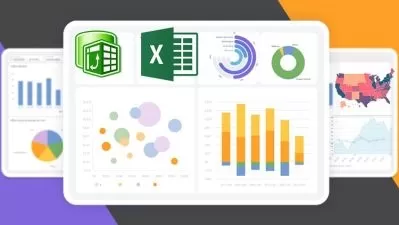
Essentials of Building Excel Dashboards
Donald F.
1:02:53
Description
Learn All About Creating Excel Dashboards
What You'll Learn?
- Learn the process of creating a dashboard worksheet
- How to summarize spreadsheet data
- Learn to set up a supporting workbook
- How to manage and filter data
- Learn to streamline charts for dashboards and create sparklines
- How to create and manage cell links using PivotTable data in a formula
- Learn about extending your dashboard with hidden rows
Who is this for?
What You Need to Know?
More details
DescriptionIn this course you will learn the basics of creating Excel dashboards. This course takes you through all you need to know to make beautiful Excel dashboards from start to finish. You will learn how to create dashboards in Excel.
Dashboards in Microsoft Excel provides a powerful tool for summarizing and evaluating the performance of your business or organization. Mastering those skills you need to create effective dashboards will let you work quickly and make great decisions.Â
An Excel Dashboard provides insight, analysis and alerts. They're fully interactive and dynamic and can help with project management, customer service, retail management, financial forecasting and much more.
This comprehensive Excel Dashboard Course will teach you the simple techniques you can apply in Excel to make amazing dashboards that will set your skill level apart from the crowd.
Learn how to build Excel Dashboard reports from the ground up. By applying the simple techniques, you will have the skills to be able to create reports that save loads of time.
A dashboard is a visual representation of key metrics that allow you to quickly view and analyze your data in one place. Dashboards not only provide consolidated data views, but a self-service business intelligence opportunity, where users are able to filter the data to display just what’s important to them. In the past, Excel reporting often required you to generate multiple reports for different people or departments depending on their needs.
Who this course is for:
- Business Professionals who use Excel
- Data analysts
- Anyone wanting to learn to create Excel dashboards and reports
In this course you will learn the basics of creating Excel dashboards. This course takes you through all you need to know to make beautiful Excel dashboards from start to finish. You will learn how to create dashboards in Excel.
Dashboards in Microsoft Excel provides a powerful tool for summarizing and evaluating the performance of your business or organization. Mastering those skills you need to create effective dashboards will let you work quickly and make great decisions.Â
An Excel Dashboard provides insight, analysis and alerts. They're fully interactive and dynamic and can help with project management, customer service, retail management, financial forecasting and much more.
This comprehensive Excel Dashboard Course will teach you the simple techniques you can apply in Excel to make amazing dashboards that will set your skill level apart from the crowd.
Learn how to build Excel Dashboard reports from the ground up. By applying the simple techniques, you will have the skills to be able to create reports that save loads of time.
A dashboard is a visual representation of key metrics that allow you to quickly view and analyze your data in one place. Dashboards not only provide consolidated data views, but a self-service business intelligence opportunity, where users are able to filter the data to display just what’s important to them. In the past, Excel reporting often required you to generate multiple reports for different people or departments depending on their needs.
Who this course is for:
- Business Professionals who use Excel
- Data analysts
- Anyone wanting to learn to create Excel dashboards and reports
User Reviews
Rating
Donald F.
Instructor's Courses
Udemy
View courses Udemy- language english
- Training sessions 14
- duration 1:02:53
- English subtitles has
- Release Date 2024/02/03


![Dashboard Design Fundamentals [2022] - Dashboards that work](https://traininghub.ir/image/course_pic/1747-x225.webp)


