Essential Excel for Business Analysts and Consultants
Asen Gyczew
5:22:20
Description
Master the formulas and tricks that will save you time and make you as efficient as consultants in McKinsey, BCG, Bain
What You'll Learn?
- You will master the most crucial functions and features of Excel
- Understand the main challenges in analyzing data in Excel
- Get ready made analyses in Excel
- Analyze complex business problems in Excel
- You will master essential Excel shortcuts that will help you drastically speed up your work in Excel
- You will learn how to structure Analysis in Excel for your work as Management Consultant or Business Analyst
Who is this for?
What You Need to Know?
More details
DescriptionWhat is the aim of this course? Â
Excel is the most often used first-choice tool of every business analyst and consultant. Maybe it is not the fanciest or most sophisticated one,  yet it is universally understood by everybody especially your boss and your customers.  Â
Excel is still a pretty advanced tool with countless features and functions. I have mastered quite a lot of them during my studies and while working. After some time in consulting, I discovered that most of them are not that useful; some of them bring more problems than solutions. On top of that, there are features that we are taught at university that are not flexible and pretty time-consuming.  While working as a business analyst I developed my own set of tricks to deal with Excel  I learned how to make my analyses idiot-proven and extremely universal.  Â
I will NOT teach you the entire Excel as it is simply not efficient (and frankly you don’t need it). This course is organized around the 80/20 rule and I want to teach you the most useful (from a business analyst/consultant perspective) formulas as fast as possible. I want you also to acquire thanks to the course good habits in Excel that will save you loads of time. Â
If done properly, this course will transform you in 1 day into a pretty good business analyst that knows how to use Excel in a smart way.
This course is based on my 15 years of experience as a consultant in top consulting firms and as a Board Member responsible for strategy, performance improvement, and turn-arounds in the biggest firms from Retail, FMCG, SMG, B2B, and services sectors that I worked for. I have carried out or supervised over 90 different performance improvement projects in different industries that generated in a total of 2 billion in additional EBITDA. On the basis of what you will find in this course, I have trained in person over 100 consultants, business analysts, and managers who now are Partners in PE and VC funds, Investment Directors and Business Analysts in PE and VC, Operational Directors, COO, CRO, CEO, Directors in Consulting Companies, Board Members, etc. On top of that my courses on Udemy were already taken by more than 224 000 students including people working in EY, Walmart, Booz Allen Hamilton, Adidas, Naspers, Alvarez & Marsal, PwC, Dell, Walgreens, Orange, and many others.
I teach step by step on the basis of Excel files that will be attached to the course. To make the best out of the course you should follow my steps and repeat what I do with the data after every lecture. Don’t move to the next lecture if you have not done what I show in the lecture that you have gone through. Â
I assume that you know basic Excel so the basic features (i.e. how to write formulas in Excel) are not explained in this course. I concentrate on intermediate and advanced solutions and purposefully get rid of some things that are advanced yet later become very inflexible and useless (i.e. naming the variables). In the end, I will show 4 full-blown analyses in Excel that use the tricks that I show in the lectures. Â
To every lecture, you will find attached (in additional resources) the Excel shown in the Lecture so as a part of this course you will also get a library of ready-made analyses that can, with certain modifications, be applied by you in your work. Â
Why have I decided to create this course? Â
I have done a number of courses showing you how to analyze data in Excel. Yet, I have noticed that some students lack fluency in operations in Excel. This course is designed to fill in the gap and help you fully appreciate my other courses for business analysts and consultants. It can be used also as a standalone course that will help you to be smart in Excel   Â
In what way will you benefit from this course? Â
The course is a practical, step-by-step guide loaded with tons of analyses, tricks, and hints that will significantly improve the speed with which you do the analyses as well as the quality of the conclusions coming out of available in your company data. There is little theory – mainly examples, a lot of tips from my own experience, and other notable examples worth mentioning. Our intention is that thanks to the course you will know: Â
How to use Excel in a smart way to be able to analyze data fast and efficiently
How to draw conclusions from analyses – chosen examples of analyses
How to be efficient in your work as an analyst?
How to build Excels that is understandable for you and your team, even after some time
You can also ask me any question either through the discussion mode or by messaging me directly.  Â
How the course is organized? Â
The course is divided currently into the following sections:Â Â
Introduction. We begin with a little intro to the course Â
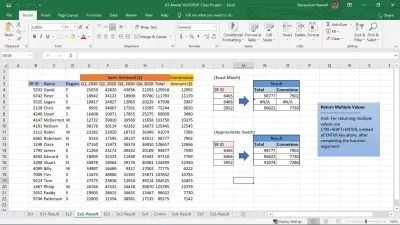
How to merge data from different sources. Quite often as an analyst, you will have to combine data from different sources. In this section, I will show you how to do it using the VLOOKUP function and others to make sure that you can easily combine data from different tables into the desired analysis. You will also see how to use HLOOKUP, MATCH, SUMIFS, and INDEX functions.
Cleaning and unifying data.  50% of your time will be lost on setting the data right so it can be used for analyses. In this section, you will   learn how to clean and unify data fast Â
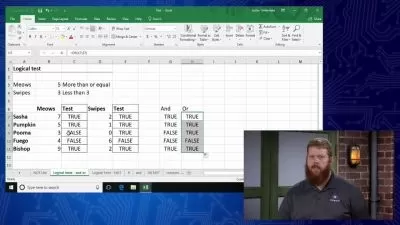
How to use the IF function and what you can do instead? Most of the analyses require you to make them dependable on something. For this, you can use the IF function which gets messy with more complicated formulas. I will show you how to avoid the mess and in most cases not use the IF function Â
Pivot Tables. As a business analyst, you will have to look at data on different levels. I will show you how to do it with Pivot Tables, and Pivot Charts, and what to do instead. Â
Other useful functions. In this section, I will show you other useful functions that you should master Â
Example of analysis. Here we show a full analysis from start to end including drawing conclusions. This will show you want should be the end result Â
Tools for analyzing data. On top of the Excel functions, you have available other tools in Excel that we will discuss in the section. Most of them save you a lot of trouble in analyzing data Â
Being faster with Excel. If you spend 6-8 hours a day with Excel you have to be fast and not to waste your valuable time. Here I will show you how to do it Â
Visual Basic – the main things you should know. Sometimes it is much easier to do something in Visual Basic than go via typical Excel formulas. In some cases, Visual Basics create new opportunities. Here I will show you the most useful elements of Visual Basic. Â
Essential Excel shortcuts. In this section, we will discuss the essential shortcuts that will help you do the analyses much faster.
You will be able also to download many additional resources Â
Excels with analyses shown in the course
Links to additional presentations and movies
Links to books worth reading
At the end of my course, students will be able to… Â
You will master the most crucial functions and features of Excel
Understand the main challenges in analyzing data in Excel
Perform the analyses in a very effective manner
Who should take this course? Who should not? Â
Business analysts
Researchers
Controllers
Consultants
Small and medium business owners
Startups founders  Â
What will students need to know or do before starting this course? Â
Basic Excel
Basic knowledge of economics or finance
Who this course is for:
- Business analysts
- Consultants
- Researchers
- Controllers
- Small and medium business owners
- Startups founders
What is the aim of this course? Â
Excel is the most often used first-choice tool of every business analyst and consultant. Maybe it is not the fanciest or most sophisticated one,  yet it is universally understood by everybody especially your boss and your customers.  Â
Excel is still a pretty advanced tool with countless features and functions. I have mastered quite a lot of them during my studies and while working. After some time in consulting, I discovered that most of them are not that useful; some of them bring more problems than solutions. On top of that, there are features that we are taught at university that are not flexible and pretty time-consuming.  While working as a business analyst I developed my own set of tricks to deal with Excel  I learned how to make my analyses idiot-proven and extremely universal.  Â
I will NOT teach you the entire Excel as it is simply not efficient (and frankly you don’t need it). This course is organized around the 80/20 rule and I want to teach you the most useful (from a business analyst/consultant perspective) formulas as fast as possible. I want you also to acquire thanks to the course good habits in Excel that will save you loads of time. Â
If done properly, this course will transform you in 1 day into a pretty good business analyst that knows how to use Excel in a smart way.
This course is based on my 15 years of experience as a consultant in top consulting firms and as a Board Member responsible for strategy, performance improvement, and turn-arounds in the biggest firms from Retail, FMCG, SMG, B2B, and services sectors that I worked for. I have carried out or supervised over 90 different performance improvement projects in different industries that generated in a total of 2 billion in additional EBITDA. On the basis of what you will find in this course, I have trained in person over 100 consultants, business analysts, and managers who now are Partners in PE and VC funds, Investment Directors and Business Analysts in PE and VC, Operational Directors, COO, CRO, CEO, Directors in Consulting Companies, Board Members, etc. On top of that my courses on Udemy were already taken by more than 224 000 students including people working in EY, Walmart, Booz Allen Hamilton, Adidas, Naspers, Alvarez & Marsal, PwC, Dell, Walgreens, Orange, and many others.
I teach step by step on the basis of Excel files that will be attached to the course. To make the best out of the course you should follow my steps and repeat what I do with the data after every lecture. Don’t move to the next lecture if you have not done what I show in the lecture that you have gone through. Â
I assume that you know basic Excel so the basic features (i.e. how to write formulas in Excel) are not explained in this course. I concentrate on intermediate and advanced solutions and purposefully get rid of some things that are advanced yet later become very inflexible and useless (i.e. naming the variables). In the end, I will show 4 full-blown analyses in Excel that use the tricks that I show in the lectures. Â
To every lecture, you will find attached (in additional resources) the Excel shown in the Lecture so as a part of this course you will also get a library of ready-made analyses that can, with certain modifications, be applied by you in your work. Â
Why have I decided to create this course? Â
I have done a number of courses showing you how to analyze data in Excel. Yet, I have noticed that some students lack fluency in operations in Excel. This course is designed to fill in the gap and help you fully appreciate my other courses for business analysts and consultants. It can be used also as a standalone course that will help you to be smart in Excel   Â
In what way will you benefit from this course? Â
The course is a practical, step-by-step guide loaded with tons of analyses, tricks, and hints that will significantly improve the speed with which you do the analyses as well as the quality of the conclusions coming out of available in your company data. There is little theory – mainly examples, a lot of tips from my own experience, and other notable examples worth mentioning. Our intention is that thanks to the course you will know: Â
How to use Excel in a smart way to be able to analyze data fast and efficiently
How to draw conclusions from analyses – chosen examples of analyses
How to be efficient in your work as an analyst?
How to build Excels that is understandable for you and your team, even after some time
You can also ask me any question either through the discussion mode or by messaging me directly.  Â
How the course is organized? Â
The course is divided currently into the following sections:Â Â
Introduction. We begin with a little intro to the course Â
How to merge data from different sources. Quite often as an analyst, you will have to combine data from different sources. In this section, I will show you how to do it using the VLOOKUP function and others to make sure that you can easily combine data from different tables into the desired analysis. You will also see how to use HLOOKUP, MATCH, SUMIFS, and INDEX functions.
Cleaning and unifying data.  50% of your time will be lost on setting the data right so it can be used for analyses. In this section, you will   learn how to clean and unify data fast Â
How to use the IF function and what you can do instead? Most of the analyses require you to make them dependable on something. For this, you can use the IF function which gets messy with more complicated formulas. I will show you how to avoid the mess and in most cases not use the IF function Â
Pivot Tables. As a business analyst, you will have to look at data on different levels. I will show you how to do it with Pivot Tables, and Pivot Charts, and what to do instead. Â
Other useful functions. In this section, I will show you other useful functions that you should master Â
Example of analysis. Here we show a full analysis from start to end including drawing conclusions. This will show you want should be the end result Â
Tools for analyzing data. On top of the Excel functions, you have available other tools in Excel that we will discuss in the section. Most of them save you a lot of trouble in analyzing data Â
Being faster with Excel. If you spend 6-8 hours a day with Excel you have to be fast and not to waste your valuable time. Here I will show you how to do it Â
Visual Basic – the main things you should know. Sometimes it is much easier to do something in Visual Basic than go via typical Excel formulas. In some cases, Visual Basics create new opportunities. Here I will show you the most useful elements of Visual Basic. Â
Essential Excel shortcuts. In this section, we will discuss the essential shortcuts that will help you do the analyses much faster.
You will be able also to download many additional resources Â
Excels with analyses shown in the course
Links to additional presentations and movies
Links to books worth reading
At the end of my course, students will be able to… Â
You will master the most crucial functions and features of Excel
Understand the main challenges in analyzing data in Excel
Perform the analyses in a very effective manner
Who should take this course? Who should not? Â
Business analysts
Researchers
Controllers
Consultants
Small and medium business owners
Startups founders  Â
What will students need to know or do before starting this course? Â
Basic Excel
Basic knowledge of economics or finance
Who this course is for:
- Business analysts
- Consultants
- Researchers
- Controllers
- Small and medium business owners
- Startups founders
User Reviews
Rating

Asen Gyczew
Instructor's Courses
Udemy
View courses Udemy- language english
- Training sessions 105
- duration 5:22:20
- English subtitles has
- Release Date 2024/10/15