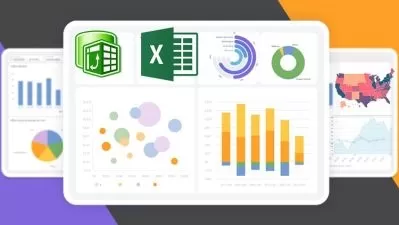
Designing Dashboards in Power BI
Nooruddin Surani
42:25
Description
Learn Power BI Fundamentals: From Getting Data to Interactive Dashboards
What You'll Learn?
- Understand the fundamentals of Power BI, its components and how it is used for data visualization and reporting.
- Learn to import and clean data from CSV sources, shaping it for analytics using Power Query Editor.
- Master the creation of interactive dashboards and reports, leveraging Power BI's drag-and-drop capabilities.
- Grasp the basics of DAX (Data Analysis Expressions) for creating simple calculated columns and measures.
- Gain hands-on experience with Power BI through project-based learning, creating a complete report from scratch.
Who is this for?
What You Need to Know?
More details
DescriptionDive into the world of data analytics with this beginner-level course on Microsoft Power BI. Designed with the novice in mind, this course takes you on a step-by-step journey, helping you unlock the power of data and transform it into actionable insights.
The course starts with an introduction to the Power BI. It then guides you on how to connect to various data sources and import data into Power BI. You will learn how to transform data using the Power Query Editor, making it ready for analysis.
Finally, you will learn how to add your visuals into a report viewer and interactive report that tells a data-driven story.
By the end of this course, you'll have the skills to use Power BI for analyzing data, creating visualizations, and generating reports.
You will learn the things in the following sequence.
Get data from CSV files
Transform data
Load data
Creating measures
Using DAX
Adding Visuals
Whether you're a business professional looking to make data-driven decisions, a student looking to bolster your analytics skills, or a small business owner seeking insights from your business data, this course will set you on the path to becoming proficient in data analytics with Power BI.
Who this course is for:
- Individuals who are new to data visualization and business intelligence tools, and want to learn from the ground up.
- Excel users looking to elevate their data analysis and visualization skills by using Power BI's powerful features.
- Business professionals, such as sales managers, financial analysts, or marketing professionals who need to create interactive reports and dashboards for their work.
- Students in fields such as business, data science, or statistics, looking to expand their technical skill set with data visualization tools.
- Small business owners who want to glean insights from their business data, but don't have a dedicated data analyst or team.
Dive into the world of data analytics with this beginner-level course on Microsoft Power BI. Designed with the novice in mind, this course takes you on a step-by-step journey, helping you unlock the power of data and transform it into actionable insights.
The course starts with an introduction to the Power BI. It then guides you on how to connect to various data sources and import data into Power BI. You will learn how to transform data using the Power Query Editor, making it ready for analysis.
Finally, you will learn how to add your visuals into a report viewer and interactive report that tells a data-driven story.
By the end of this course, you'll have the skills to use Power BI for analyzing data, creating visualizations, and generating reports.
You will learn the things in the following sequence.
Get data from CSV files
Transform data
Load data
Creating measures
Using DAX
Adding Visuals
Whether you're a business professional looking to make data-driven decisions, a student looking to bolster your analytics skills, or a small business owner seeking insights from your business data, this course will set you on the path to becoming proficient in data analytics with Power BI.
Who this course is for:
- Individuals who are new to data visualization and business intelligence tools, and want to learn from the ground up.
- Excel users looking to elevate their data analysis and visualization skills by using Power BI's powerful features.
- Business professionals, such as sales managers, financial analysts, or marketing professionals who need to create interactive reports and dashboards for their work.
- Students in fields such as business, data science, or statistics, looking to expand their technical skill set with data visualization tools.
- Small business owners who want to glean insights from their business data, but don't have a dedicated data analyst or team.
User Reviews
Rating
Nooruddin Surani
Instructor's Courses
Udemy
View courses Udemy- language english
- Training sessions 12
- duration 42:25
- English subtitles has
- Release Date 2023/09/10


![Microsoft Power BI - Everything You Need to know in [2023]](https://traininghub.ir/image/course_pic/19545-x225.webp)


