Data Visualization & UX Basics
Sven Charleer, PhD
48:04
Description
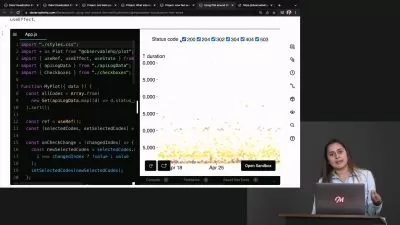
Learn the basics of UX and data visualisation design! In this course you will learn how to create data visualisation designs that are proven to be useful, usable, and engaging. We take a user-centred approach: you will learn the basic techniques of user research, create personas and user stories, design data visualization sketches and mockups, and evaluate your designs with real users.
Don’t let the word “data” in data visualization scare you. A basic idea of “the data that’s available” is required before starting a data visualization design project, but this can be as little as e.g. “we have data on cars driving through New York City”. The UX approach means that we start from the user and investigate what they require instead of the usual data-first approach.. We explore the possibilities through imagination and user requirements. We will cover the basics required to create insightful data visualizations and learn what methods to avoid.
By the end of this course, you will possess the knowledge to navigate and perform the UX process, the basics of data visualizations, the ability to perform user research, and creating designs that are useful and usable, not just to you, but to your users, and grounded in proof.
For who?
This course is ideal for graphic designers wanting to move into UX and/or data visualization. By understanding the basics of UX and data visualization design, this course will help you not only learn valuable new skills, but through your background in design help the data visualization industry reach new levels. Your design skills and this course combined will result in not just beautiful but also useful and usable data visualizations that can have a major impact on real users and businesses.
This course is also valuable to anyone interested in the basics of UX and data visualization. While basic design skills help, they are not required. Designing a useful and usable visualization requires many steps, and it is unlikely that companies hire just one person to do them all. In this course there is a heavy focus on user research, and anyone can easily get the project to a state that is proven to be useful and usable: a perfect state to hand over to designer and programmers.
Why this class?
My name is Sven Charleer and I am teaching this class. I am a Freelance Data Visualization Experience Designer/Adviser. I have a PhD in data visualization (dashboard) design and user experience. I have 16 years of experience of which 6 were spent in academia guiding and teaching students on topics such as data visualization, user evaluations, AR/VR and more. The content of this course is based on proven methods in academic and industry environments.
The project
The class teaches you the entire UX process and how to apply it to data visualization design. During this class, you will choose a data-related topic you are passionate about in order to create a data visualization sketch/mockup that is proven to be useful, usable, and in some cases, enjoyable. You will research the topic through different UX methods, sketch ideas based on your newly acquired data visualization knowledge, evaluate your designs with potential users, and create a final mockup(s).
What You'll Learn?
- Data Visualization
- User Experience
- Prototyping
- Creative
- Mobile Apps
- App Design
- UI/UX Design
More details
User Reviews
Rating
Sven Charleer, PhD
Instructor's CoursesI'm Sven and I am a freelance data visualization experience designer/adviser based near Antwerp, Belgium. I built up 6 years of UX experience during my PhD and postdoc, creating dashboards and visualizations for education, games, and unemployment services. Before that, I spent 10 years as a software engineer in HR, video games, and web.
In need of dataviz assistance? Check out my website or connect with me on LinkedIn!

SkillShare
View courses SkillShare- language english
- Training sessions 15
- duration 48:04
- English subtitles has
- Release Date 2024/02/25


