00001 Welcome to the course.mp4
00:38
00002 Introduction to Python.mp4
00:53
00003 Setting up Python.mp4
02:24
00004 What is Jupyter.mp4
00:59
00005 Anaconda Installation - Windows Mac and Ubuntu.mp4
04:15
00006 How to Implement Python in Jupyter.mp4
00:44
00007 Managing Directories in Jupyter Notebook.mp4
02:48
00008 Input Output.mp4
01:44
00009 Working with Different Datatypes.mp4
01:05
00010 Variables.mp4
01:50
00011 Arithmetic Operators.mp4
01:48
00012 Comparison Operators.mp4
00:43
00013 Logical Operators.mp4
03:05
00014 Conditional Statements.mp4
02:20
00015 Loops.mp4
04:33
00016 Sequences - Lists.mp4
03:18
00017 Sequences - Dictionaries.mp4
02:48
00018 Sequences - Tuples.mp4
01:07
00019 Functions - Built-in Functions.mp4
00:26
00020 Functions - User-Defined Functions.mp4
03:24
00021 Installing Libraries.mp4
00:36
00022 Importing Libraries.mp4
01:49
00023 Pandas Library for Data Science.mp4
00:49
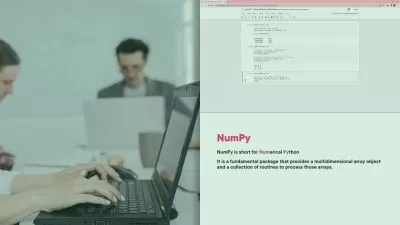
00024 NumPy Library for Data Science.mp4
00:51
00025 Pandas versus NumPy.mp4
00:33
00026 Matplotlib Library for Data Science.mp4
00:38
00027 Seaborn Library for Data Science.mp4
00:20
00028 Introduction to NumPy Arrays.mp4
00:45
00029 Creating NumPy Arrays.mp4
06:13
00030 Indexing NumPy Arrays.mp4
05:45
00031 Array Shape.mp4
00:35
00032 Iterating Over NumPy Arrays.mp4
05:07
00033 Basic NumPy Arrays - zeros.mp4
01:33
00034 Basic NumPy Arrays - ones.mp4
01:11
00035 Basic NumPy Arrays - full.mp4
01:16
00036 Adding a Scalar.mp4
01:41
00037 Subtracting a Scalar.mp4
01:04
00038 Multiplying by a Scalar.mp4
01:17
00039 Dividing by a Scalar.mp4
01:25
00040 Raise to a Power.mp4
00:48
00041 Transpose.mp4
00:48
00042 Element-Wise Addition.mp4
02:00
00043 Element-Wise Subtraction.mp4
00:56
00044 Element-Wise Multiplication.mp4
00:58
00045 Element-Wise Division.mp4
01:04
00046 Matrix Multiplication.mp4
01:33
00047 Statistics.mp4
02:56
00048 What is a Python Pandas DataFrame.mp4
00:58
00049 What is a Python Pandas Series.mp4
00:42
00050 DataFrame versus Series.mp4
00:28
00051 Creating a DataFrame Using Lists.mp4
03:17
00052 Creating a DataFrame Using a Dictionary.mp4
01:06
00053 Loading CSV Data into Python.mp4
01:52
00054 Changing the Index Column.mp4
01:06
00055 Inplace.mp4
01:20
00056 Examining the DataFrame - Head and Tail.mp4
00:36
00057 Statistical Summary of the DataFrame.mp4
00:37
00058 Slicing Rows Using Bracket Operators.mp4
01:26
00059 Indexing Columns Using Bracket Operators.mp4
00:51
00060 Boolean List.mp4
01:15
00061 Filtering Rows.mp4
01:22
00062 Filtering rows using and Operators.mp4
01:51
00063 Filtering Data Using loc.mp4
03:35
00064 Filtering Data Using iloc.mp4
02:23
00065 Adding and Deleting Rows and Columns.mp4
02:41
00066 Sorting Values.mp4
01:39
00067 Exporting and Saving Pandas DataFrames.mp4
01:29
00068 Concatenating DataFrames.mp4
00:59
00069 Groupby.mp4
02:51
00070 Introduction to Data Cleaning.mp4
00:37
00071 Quality of Data.mp4
00:47
00072 Examples of Anomalies.mp4
01:05
00073 Median-based Anomaly Detection.mp4
02:42
00074 Mean-Based Anomaly Detection.mp4
02:50
00075 Z-Score-Based Anomaly Detection.mp4
02:50
00076 Interquartile Range for Anomaly Detection.mp4
04:33
00077 Dealing with Missing Values.mp4
06:01
00078 Regular Expressions.mp4
06:57
00079 Feature Scaling.mp4
03:18
00080 Introduction.mp4
00:29
00081 Setting Up Matplotlib.mp4
00:33
00082 Plotting Line Plots using Matplotlib.mp4
01:46
00083 Title Labels and Legend.mp4
06:46
00084 Plotting Histograms.mp4
01:22
00085 Plotting Bar Charts.mp4
02:04
00086 Plotting Pie Charts.mp4
02:49
00087 Plotting Scatter Plots.mp4
05:44
00088 Plotting Log Plots.mp4
00:41
00089 Plotting Polar Plots.mp4
02:06
00090 Handling Dates.mp4
00:43
00091 Creating Multiple Subplots in One Figure.mp4
03:38
00092 Introduction.mp4
00:19
00093 What is Exploratory Data Analysis.mp4
00:30
00094 Univariate Analysis.mp4
01:41
00095 Univariate Analysis - Continuous Data.mp4
06:01
00096 Univariate Analysis - Categorical Data.mp4
02:16
00097 Bivariate Analysis - Continuous and Continuous.mp4
04:32
00098 Bivariate Analysis - Categorical and Categorical.mp4
03:07
00099 Bivariate Analysis - Continuous and Categorical.mp4
01:51
00100 Detecting Outliers.mp4
05:34
00101 Categorical Variable Transformation.mp4
04:22
00102 Introduction to Time Series.mp4
02:15
00103 Getting Stock Data Using yfinance.mp4
03:15
00104 Converting a Dataset into Time Series.mp4
04:23
00105 Working with Time Series.mp4
03:49
00106 Time Series Data Visualization with Python.mp4
03:14