Data Analyst's Toolbox: Excel, SQL, Power BI
Vardges Zardaryan
8:03:24
Description
Gain hands-on experience with Excel, Statistics, MySQL and Power BI to drive powerful analysis and communicate insights
What You'll Learn?
- Get hands-on experience with 4 groups of skills that needs each data analyst - Excel, SQL, Statistics, and Power BI
- Learn MS Excel for cleaning, preparing, calculating and analysing data
- Learn how to write advanced Excel formulas by SUBTOTAL, SUMIFS, COUNTIFS, AVERAGEIFS, VLOOKUP, INDEX, MATCH and other 50+ functions
- Learn Pivot Tables so you can quickly get insights from your data
- Learn Statistical Analysis in MS Excel by Data Analysis ToolPak including Descriptive statistics and Linear regression
- Learn how to perform A/B testing and what is P-value
- Start using MySQL – the #1 Database Management System
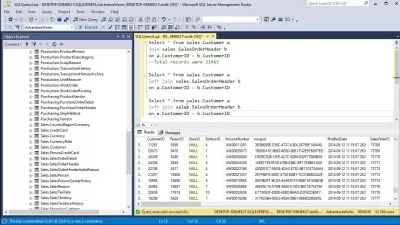
- Learn how to write complex SQL queries to obtain useful information from the database
- Learn Microsoft Power BI for analysing and visualizing data
- Learn how to connect Power BI to an Excel file and MySQL database and create interactive dashboards for these datasets
- Put all 4 groups of skills together for identifying insights and trends based on real-life data sets
Who is this for?
What You Need to Know?
More details
DescriptionJoin to over 5,000 students and learn Excel, Statistics, SQL, and Power BI in one course to analyze data, identify trends, design visualizations, and drive business decisions with realâ€world data sets. Gain a competitive advantage in the job market.
WHY WOULD YOU CHOOSE TO LEARN DATA ANALYSIS TOOLS?
Data analysis is a process of inspecting, cleaning, transforming and modeling data with the goal of discovering useful information, informing conclusion and supporting decision-making. Data Analyst is one of the sexiest jobs in nowadays. Knowing of Excel, MySQL, Power BI and Statistics can get you a promotion and make you a rock star at your company.
WHY TAKE THIS SPECIFIC COURSE?
This course is concentrated on the most important tools for performing data analysis on the job. In this course you'll play the role of data analyst at a delivery company and you'll be working with real-life data sets. You will learn both technical and business thinking skills, and get important skills to get hired. You don't need to spend months to learn data analysis tools. As you go through the course, you'll be able to apply what you learnt immediately to your job.
Author of this course has over 10 years of working experience in large financial organizations and over 5 years of experience of online and in-person trainings. He has dozens of courses on Excel, SQL, Power BI, Access, and more than 20,000 students in total. Surely he knows what you need.
HERE WHY THIS COURSE IS ONE OF THE BEST COURSES ON UDEMY:
★★★★★ Mary Rose
It was well explained and captured the basic elements of the 4 skills.
★★★★★ Vinh Au
This is one of the best course that I've taken. The instructor show just enough example to help you understand the concept within a short period of time. No unnecessary information. If you are a beginner and try to learn data analysis. This is the course to take. Highly recommend.
★★★★★ Irina Arakelyan
Very comprehensive course with real work with data and real examples. I found all what I need in one course. I appreciate this instructor and really recommend this course.
WHAT ARE SOME TOOLS AND TECHNIQUES YOU WILL LEARN IN THIS COURSE?
You'll learn:
1. MS Excel:
· Unlock the power of MS Excel to utilize its analytical tools — no matter your experience level.
· Execute conditional aggregation commands (SUBTOTAL, SUMIFS, COUNTIFS, etc.) to summarize data.
· Practice applying the Pivot Table tool for data analysis of a sample business case.
· Use the VLOOKUP, INDEX and MATCH functions to manipulate data sets in MS Excel.
2. Statistics:
· Understand the value of descriptive and predictive statistics.
· Learn to describe data using its Mean, Median, Mode, Range, and Variance.
· Create Linear regression model by using Data Analysis ToolPak in MS Excel.
· Perform A/B Testing and calculate Statistical Significance of your test.
3. MySQL:
· Filter data using advanced SQL commands (Select, Where, Group By, Having, Order By, Limit).
· Obtain data by creating relationships between tables using Joins.
· Summarize data sets by employing aggregation commands (“Sum,†“Average,†“Count,†etc.).
· Use CASE statements to structure data and create new attributes.
4. Power BI:
· Get hands-on, practical experience navigating the Power BI software interface.
· Connect your data to Power BI and identify the best ways to visualize and display your results.
· Analyze and visualize your data in Power BI in order to answer basic questions.
· Create advanced interactive dashboards for presentation.
So, what are you waiting for? Join today and get immediate, lifetime access to the following:
· 8+ hours on-demand video
· Downloadable project files
· Practical exercises & quizzes
· 1-on-1 expert support
· Course Q&A forum
· 30-day money-back guarantee
· Digital Certificate of Completion
See you in there!
Sincerely,
Vardges Zardaryan
P.S. Looking to master the full Microsoft Excel, Power BI + SQL stack? Search for "Vardges Zardaryan" and complete the courses below to become a Data Analysis Rock Star:
1. Mastering Data Analysis in Excel
2. Mastering Data Analysis with Power BI
3. Data Analyst’s Toolbox: Excel, SQL, Power BI
4. The Complete Introduction to SQL for Data Analytics
Who this course is for:
- Anyone looking for hands-on data analysis course and real-life projects
- Anyone looking to pursue a career in data analysis or business intelligence
- Business professionals looking to improve their analytical skills and learn more tools for that
- Anyone looking to learn different softwares for effective data analysis
- Data analysts looking to continue their professional development and career advancement
- Students who want a comprehensive, engaging, and highly interactive approach to training
Join to over 5,000 students and learn Excel, Statistics, SQL, and Power BI in one course to analyze data, identify trends, design visualizations, and drive business decisions with realâ€world data sets. Gain a competitive advantage in the job market.
WHY WOULD YOU CHOOSE TO LEARN DATA ANALYSIS TOOLS?
Data analysis is a process of inspecting, cleaning, transforming and modeling data with the goal of discovering useful information, informing conclusion and supporting decision-making. Data Analyst is one of the sexiest jobs in nowadays. Knowing of Excel, MySQL, Power BI and Statistics can get you a promotion and make you a rock star at your company.
WHY TAKE THIS SPECIFIC COURSE?
This course is concentrated on the most important tools for performing data analysis on the job. In this course you'll play the role of data analyst at a delivery company and you'll be working with real-life data sets. You will learn both technical and business thinking skills, and get important skills to get hired. You don't need to spend months to learn data analysis tools. As you go through the course, you'll be able to apply what you learnt immediately to your job.
Author of this course has over 10 years of working experience in large financial organizations and over 5 years of experience of online and in-person trainings. He has dozens of courses on Excel, SQL, Power BI, Access, and more than 20,000 students in total. Surely he knows what you need.
HERE WHY THIS COURSE IS ONE OF THE BEST COURSES ON UDEMY:
★★★★★ Mary Rose
It was well explained and captured the basic elements of the 4 skills.
★★★★★ Vinh Au
This is one of the best course that I've taken. The instructor show just enough example to help you understand the concept within a short period of time. No unnecessary information. If you are a beginner and try to learn data analysis. This is the course to take. Highly recommend.
★★★★★ Irina Arakelyan
Very comprehensive course with real work with data and real examples. I found all what I need in one course. I appreciate this instructor and really recommend this course.
WHAT ARE SOME TOOLS AND TECHNIQUES YOU WILL LEARN IN THIS COURSE?
You'll learn:
1. MS Excel:
· Unlock the power of MS Excel to utilize its analytical tools — no matter your experience level.
· Execute conditional aggregation commands (SUBTOTAL, SUMIFS, COUNTIFS, etc.) to summarize data.
· Practice applying the Pivot Table tool for data analysis of a sample business case.
· Use the VLOOKUP, INDEX and MATCH functions to manipulate data sets in MS Excel.
2. Statistics:
· Understand the value of descriptive and predictive statistics.
· Learn to describe data using its Mean, Median, Mode, Range, and Variance.
· Create Linear regression model by using Data Analysis ToolPak in MS Excel.
· Perform A/B Testing and calculate Statistical Significance of your test.
3. MySQL:
· Filter data using advanced SQL commands (Select, Where, Group By, Having, Order By, Limit).
· Obtain data by creating relationships between tables using Joins.
· Summarize data sets by employing aggregation commands (“Sum,†“Average,†“Count,†etc.).
· Use CASE statements to structure data and create new attributes.
4. Power BI:
· Get hands-on, practical experience navigating the Power BI software interface.
· Connect your data to Power BI and identify the best ways to visualize and display your results.
· Analyze and visualize your data in Power BI in order to answer basic questions.
· Create advanced interactive dashboards for presentation.
So, what are you waiting for? Join today and get immediate, lifetime access to the following:
· 8+ hours on-demand video
· Downloadable project files
· Practical exercises & quizzes
· 1-on-1 expert support
· Course Q&A forum
· 30-day money-back guarantee
· Digital Certificate of Completion
See you in there!
Sincerely,
Vardges Zardaryan
P.S. Looking to master the full Microsoft Excel, Power BI + SQL stack? Search for "Vardges Zardaryan" and complete the courses below to become a Data Analysis Rock Star:
1. Mastering Data Analysis in Excel
2. Mastering Data Analysis with Power BI
3. Data Analyst’s Toolbox: Excel, SQL, Power BI
4. The Complete Introduction to SQL for Data Analytics
Who this course is for:
- Anyone looking for hands-on data analysis course and real-life projects
- Anyone looking to pursue a career in data analysis or business intelligence
- Business professionals looking to improve their analytical skills and learn more tools for that
- Anyone looking to learn different softwares for effective data analysis
- Data analysts looking to continue their professional development and career advancement
- Students who want a comprehensive, engaging, and highly interactive approach to training
User Reviews
Rating
Vardges Zardaryan
Instructor's Courses
Udemy
View courses Udemy- language english
- Training sessions 95
- duration 8:03:24
- English subtitles has
- Release Date 2023/11/14


