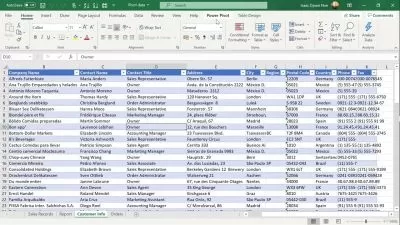
Create rich and interactive Dashboard using Microsoft Excel.
FestMan Learning Hub, Thomas Festus Cudjoe
2:36:48
Description
Learn how to build a fully interactive and a self-service business intelligence dashboard using Microsoft Excel.
What You'll Learn?
- Analyze data using PivotTables
- Visualize insights using advanced charts in Excel
- Customize report themes and backgrounds in Excel
- Work with slicers and reports connection
- Design interactive dashboards and reports
- Protect workbooks and worksheets
- Design custom visuals in Excel
Who is this for?
More details
DescriptionData visualization and Dashboard design skills have become a sought-after skill and valuable to businesses in almost all industries.
A dashboard is a visual representation of key metrics that allow users to quickly view and analyze data in one place.
Dashboards not only provide consolidated data views, but serves as a self-service business intelligence tool, where users are able to explore data and discover insights quickly.
Using Data Analytics tools like Microsoft Excel, you can develop rich and interactive dashboards and reports. In this course, you will learn how to use Microsoft Excel to analyze and visualize data to design interactive and automate reports and dashboards.
Your ability to design and develop a compelling and automated dashboards and reports will help you stand out at the workplace and help you accelerate your career.
This course is designed for individuals and analysts who use data in the business setting. If you are responsible for presenting data in your day-to-day job, or a data analyst, then this course is for you. You will learn how to design interactive and visually striking dashboard using Microsoft Excel.
We will adopt a guided learning approach to help you learn and master the concept and the process for designing rich and dynamic dashboards.
Who this course is for:
- Microsoft Excel users
- Professionals who work with Excel to develop reports and dashboards
- Data Analysts
- Accounting and Finance professionals
- Data Science professionals
- Data analytics enthusiasts
Data visualization and Dashboard design skills have become a sought-after skill and valuable to businesses in almost all industries.
A dashboard is a visual representation of key metrics that allow users to quickly view and analyze data in one place.
Dashboards not only provide consolidated data views, but serves as a self-service business intelligence tool, where users are able to explore data and discover insights quickly.
Using Data Analytics tools like Microsoft Excel, you can develop rich and interactive dashboards and reports. In this course, you will learn how to use Microsoft Excel to analyze and visualize data to design interactive and automate reports and dashboards.
Your ability to design and develop a compelling and automated dashboards and reports will help you stand out at the workplace and help you accelerate your career.
This course is designed for individuals and analysts who use data in the business setting. If you are responsible for presenting data in your day-to-day job, or a data analyst, then this course is for you. You will learn how to design interactive and visually striking dashboard using Microsoft Excel.
We will adopt a guided learning approach to help you learn and master the concept and the process for designing rich and dynamic dashboards.
Who this course is for:
- Microsoft Excel users
- Professionals who work with Excel to develop reports and dashboards
- Data Analysts
- Accounting and Finance professionals
- Data Science professionals
- Data analytics enthusiasts
User Reviews
Rating
FestMan Learning Hub, Thomas Festus Cudjoe
Instructor's Courses
Udemy
View courses Udemy- language english
- Training sessions 28
- duration 2:36:48
- Release Date 2023/03/07


