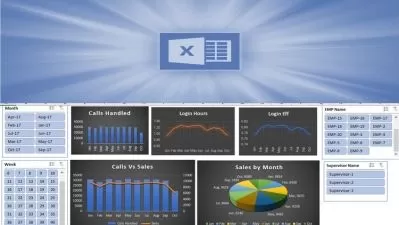
Create Interactive Dashboard using MS Excel
Focused View
1:59:39
6 View
1.1 Dashboard Material.zip
1. Content.mp4
02:16
2. Visualization Game.mp4
04:29
3. Importance of Visualization.mp4
07:56
4. What is Dashboard.mp4
04:09
5. Types of Dashboard.mp4
04:25
6. Key Benefits of Dashboard.mp4
04:48
7. Things to be considered before creating Dashboard.mp4
04:57
1. Data Description.mp4
02:01
2. Derive Parameters for Dashboard.mp4
02:57
3. Strategy to Display Parameters in Dashboard.mp4
07:36
4. Creating Blank Structure for Dashboard.mp4
06:08
5. Complete Header of Dashboard.mp4
00:58
1. Create Measures for Dashboard.mp4
07:30
2. Prepare Summary of Top 5 Items.mp4
05:24
3. Prepare Summary for Geo Map and Pie Chart.mp4
04:53
4. Create Bar Chart for Top 5 Items Part 1.mp4
08:34
5. Create Bar Chart for Top 5 Items Part 2.mp4
02:31
1. Updating Dynamic Measures in Dashboard.mp4
04:26
2. Creating and Updating Pie Chart in Dashboard.mp4
09:47
3. Creating Geo Map andd Trick to make it Dynamic.mp4
03:16
4. Add Calculative Measure on Dashboard.mp4
02:54
5. Overview of Interactivity using Slicers.mp4
02:12
6. Adding Slicers Part 1.mp4
04:55
7. Adding Slicers Part 2.mp4
02:49
8. Overview of BI and BI Tools.mp4
07:48
More details
User Reviews
Rating
average 0
Focused display
Category

Udemy
View courses UdemyStudents take courses primarily to improve job-related skills.Some courses generate credit toward technical certification. Udemy has made a special effort to attract corporate trainers seeking to create coursework for employees of their company.
- language english
- Training sessions 25
- duration 1:59:39
- English subtitles has
- Release Date 2024/02/13