Complete Introduction to Tableau & Data Analysis Projects
Graeme Gordon
10:03:22
Description
No Experience Required | Tableau Data Analyst/Specialist Certification | Dashboard | Netflix Relational Database Project
What You'll Learn?
- Download Tableau and learn each topic required for the Data Analyst and Specialist Certifications with hands on and real guided examples
- Visualize data on different types of charts such as line, stacked bar, maps and dual axies charts.
- Use the analytics pane to do statistical analysis and summarize and model data effectively.
- Master the creation of interactive dashboards and stories for effective data communication.
Who is this for?
What You Need to Know?
More details
DescriptionIf you're interested in taking the Tableau Data Analyst or Tableau Desktop Specialist certification exam then you're in the right place!
This comprehensive Udemy course is designed to cover all the topics you need to ace the Tableau Data Analyst and Tableau Desktop Specialist certification exams, while also offering hands-on projects to enhance your practical skills.
Key Highlights:
From the basics of Tableau to advanced data visualization techniques, you'll study the topics required to prepare for certification.
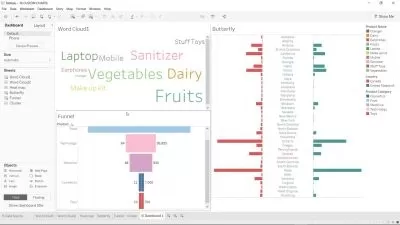
The journey continues with an exciting guided project. You'll design and build your own Tableau dashboard, gaining hands-on experience in creating visualizations and interactive dashboards. This practical project allows you to apply what you've learned and build a portfolio-ready piece of work.
There will also be a guided relational database project, starting from scratch to organize a messy sheet of data into a set of tables.
What You'll Learn:
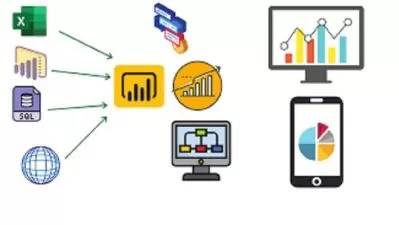
Introduction to Tableau and data visualization
Data preparation and cleaning
Advanced data visualization and dashboard design
Relational database concepts and normalization techniques
Creating ER diagrams for database design
Building your own Tableau dashboard
Who Should Enroll:
Aspiring Tableau Data Analysts and Data Specialists
Data professionals looking to enhance their Tableau skills
Anyone interested in creating impactful data visualizations
Why Choose This Course:
This course offers a balanced blend of theoretical knowledge and hands-on practice. You'll gain the confidence to tackle certification exams, while also acquiring the skills to work with real-world data scenarios.
There is also a Relational Database Project where you'll delve into the practical world of relational databases. This course will guide you through applying normalization techniques to transform a dataset into a relational structure. You'll then learn how to create an Entity-Relationship (ER) diagram, a fundamental skill for database design.
Enroll now, and kickstart your journey towards Tableau certification!
Who this course is for:
- Anyone with little to no experience with Tableau.
- Anyone preparing to take the Tableau Certified Data Analyst exam
If you're interested in taking the Tableau Data Analyst or Tableau Desktop Specialist certification exam then you're in the right place!
This comprehensive Udemy course is designed to cover all the topics you need to ace the Tableau Data Analyst and Tableau Desktop Specialist certification exams, while also offering hands-on projects to enhance your practical skills.
Key Highlights:
From the basics of Tableau to advanced data visualization techniques, you'll study the topics required to prepare for certification.
The journey continues with an exciting guided project. You'll design and build your own Tableau dashboard, gaining hands-on experience in creating visualizations and interactive dashboards. This practical project allows you to apply what you've learned and build a portfolio-ready piece of work.
There will also be a guided relational database project, starting from scratch to organize a messy sheet of data into a set of tables.
What You'll Learn:
Introduction to Tableau and data visualization
Data preparation and cleaning
Advanced data visualization and dashboard design
Relational database concepts and normalization techniques
Creating ER diagrams for database design
Building your own Tableau dashboard
Who Should Enroll:
Aspiring Tableau Data Analysts and Data Specialists
Data professionals looking to enhance their Tableau skills
Anyone interested in creating impactful data visualizations
Why Choose This Course:
This course offers a balanced blend of theoretical knowledge and hands-on practice. You'll gain the confidence to tackle certification exams, while also acquiring the skills to work with real-world data scenarios.
There is also a Relational Database Project where you'll delve into the practical world of relational databases. This course will guide you through applying normalization techniques to transform a dataset into a relational structure. You'll then learn how to create an Entity-Relationship (ER) diagram, a fundamental skill for database design.
Enroll now, and kickstart your journey towards Tableau certification!
Who this course is for:
- Anyone with little to no experience with Tableau.
- Anyone preparing to take the Tableau Certified Data Analyst exam
User Reviews
Rating

Graeme Gordon
Instructor's Courses
Udemy
View courses Udemy- language english
- Training sessions 96
- duration 10:03:22
- Release Date 2024/01/13