Complete Guide to Data Visualization with Kibana 8
Idan Chen
1:39:14
Description
Discover Elasticsearch Data Visualization Mastery: Learn Kibana for creating Visualizations, and build amazing Dashboard
What You'll Learn?
- Fundamentals of data visualization and best practices for effective visual storytelling.
- Utilization of Kibana's advanced features, such as machine learning, maps, and Canvas.
- Creation of various Kibana visualizations, including bar charts, line charts, pie charts, and more.
- Development of interactive dashboards for effective data presentation and communication.
- Best practices for optimizing Kibana performance, security, and scalability.
- Working with Dev Tools
- Installing Installation and configuration of Kibana for data visualization and exploration and kibana
- Examining and finding data such as logs
- Integration of Kibana with Elasticsearch and other Elastic Stack components.
- Familiarization with Kibana's user interface and navigation of its various features.
- Techniques for ingesting, indexing, and transforming data in Kibana for visualization purposes.
- Real-world use cases and practical applications of Kibana in different industries and domains
Who is this for?
More details
DescriptionWelcome to the Complete Guide to Data Visualization with Kibana 8 Course!
A comprehensive course designed to empower you with the skills and knowledge needed to create stunning data visualizations, and interactive dashboards, and uncover hidden insights using Kibana, the powerful data visualization tool from the Elastic Stack.
In today's data-driven world, the ability to effectively visualize and communicate information is paramount. This course will take you on a journey through the world of data visualization, starting with the fundamentals and best practices, and progressing to advanced techniques and real-world use cases. By the end of this course, you will have a thorough understanding of Kibana and be able to confidently create visually engaging dashboards and visualizations that convey meaningful insights.
Throughout this course, you will:
Learn the core concepts and principles of data visualization, including visual storytelling, chart types, and effective communication.
Get hands-on experience with Kibana, its interface, and its various features by working through practical examples and exercises.
Understand how to ingest, index, and transform data in Kibana to create powerful visualizations and dashboards.
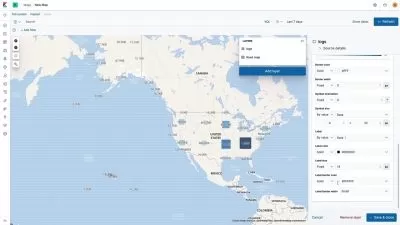
Explore a wide range of Kibana visualizations, from simple bar charts and line charts to complex heatmaps and geospatial visualizations.
Develop interactive dashboards that provide valuable insights, enabling data-driven decision-making for your organization.
Dive into Kibana's advanced features, such as machine learning, maps, Canvas, and more, to further enhance your data analysis skills.
Integrate Kibana with Elasticsearch and other components of the Elastic Stack to create a complete data analysis and visualization solution.
Learn best practices for optimizing Kibana's performance, security, and scalability in real-world scenarios.
Gain insights into practical applications of Kibana across various industries, such as finance, healthcare, e-commerce, and more.
This course is designed for data analysts, data scientists, business intelligence professionals, developers, and anyone interested in learning about Kibana and data visualization. Whether you are new to Kibana or have some experience, this course will provide you with a solid foundation and the tools needed to succeed in the world of data visualization.
Join me in this exciting journey through the world of data visualization with Kibana, and unlock the full potential of your data analysis skills. Enroll today and start transforming the way you analyze and visualize data!
Idan Chen
Who this course is for:
- Data analysts seeking to enhance their skills in data visualization and dashboard creation.
- Elasticsearch users who want to leverage Kibana for data exploration and visualizations.
- Data scientists looking to integrate Kibana into their data analysis workflows.
- Business intelligence professionals interested in adding Kibana to their analytics toolbox.
- Developers working with Elasticsearch who want to improve data presentation and reporting.
- IT professionals responsible for monitoring and visualizing log data or system metrics.
- Product managers and decision-makers requiring data-driven insights and visualizations.
- Data-driven organizations aiming to adopt Kibana for improved data analysis capabilities.
- Students studying data analytics, data science, or business intelligence courses.
- Anyone interested in learning about Kibana's features for data visualization and dashboard development.
Welcome to the Complete Guide to Data Visualization with Kibana 8 Course!
A comprehensive course designed to empower you with the skills and knowledge needed to create stunning data visualizations, and interactive dashboards, and uncover hidden insights using Kibana, the powerful data visualization tool from the Elastic Stack.
In today's data-driven world, the ability to effectively visualize and communicate information is paramount. This course will take you on a journey through the world of data visualization, starting with the fundamentals and best practices, and progressing to advanced techniques and real-world use cases. By the end of this course, you will have a thorough understanding of Kibana and be able to confidently create visually engaging dashboards and visualizations that convey meaningful insights.
Throughout this course, you will:
Learn the core concepts and principles of data visualization, including visual storytelling, chart types, and effective communication.
Get hands-on experience with Kibana, its interface, and its various features by working through practical examples and exercises.
Understand how to ingest, index, and transform data in Kibana to create powerful visualizations and dashboards.
Explore a wide range of Kibana visualizations, from simple bar charts and line charts to complex heatmaps and geospatial visualizations.
Develop interactive dashboards that provide valuable insights, enabling data-driven decision-making for your organization.
Dive into Kibana's advanced features, such as machine learning, maps, Canvas, and more, to further enhance your data analysis skills.
Integrate Kibana with Elasticsearch and other components of the Elastic Stack to create a complete data analysis and visualization solution.
Learn best practices for optimizing Kibana's performance, security, and scalability in real-world scenarios.
Gain insights into practical applications of Kibana across various industries, such as finance, healthcare, e-commerce, and more.
This course is designed for data analysts, data scientists, business intelligence professionals, developers, and anyone interested in learning about Kibana and data visualization. Whether you are new to Kibana or have some experience, this course will provide you with a solid foundation and the tools needed to succeed in the world of data visualization.
Join me in this exciting journey through the world of data visualization with Kibana, and unlock the full potential of your data analysis skills. Enroll today and start transforming the way you analyze and visualize data!
Idan Chen
Who this course is for:
- Data analysts seeking to enhance their skills in data visualization and dashboard creation.
- Elasticsearch users who want to leverage Kibana for data exploration and visualizations.
- Data scientists looking to integrate Kibana into their data analysis workflows.
- Business intelligence professionals interested in adding Kibana to their analytics toolbox.
- Developers working with Elasticsearch who want to improve data presentation and reporting.
- IT professionals responsible for monitoring and visualizing log data or system metrics.
- Product managers and decision-makers requiring data-driven insights and visualizations.
- Data-driven organizations aiming to adopt Kibana for improved data analysis capabilities.
- Students studying data analytics, data science, or business intelligence courses.
- Anyone interested in learning about Kibana's features for data visualization and dashboard development.
User Reviews
Rating

Idan Chen
Instructor's Courses
Udemy
View courses Udemy- language english
- Training sessions 38
- duration 1:39:14
- Release Date 2023/06/08