Companies Home Search Profile

Common DAX Expressions and Scenarios Power BI Playbook

Focused View

Andrew McSwiggan

5:32:29

24 View
  • 01. Course Overview.mp4
    01:39
  • 02. A Structured Approach to Power Bi Design.mp4
    05:56
  • 03. Building a Foundation.mp4
    02:43
  • 04. What Is a Dimensional Model.mp4
    02:03
  • 05. What Does a Dimensional Model Do.mp4
    06:01
  • 06. The Dimensional Modelling Process.mp4
    03:37
  • 07. Exploring the Data.mp4
    06:49
  • 08. Designing the Data Model.mp4
    02:57
  • 09. Creating Dimension Tables with GROUPBY.mp4
    06:24
  • 10. Creating a Fact Table with SUMMARIZECOLUMNS.mp4
    05:24
  • 11. Creating Data Star with the Model Tool.mp4
    05:04
  • 12. Creating Text Columns for Data Analysis.mp4
    01:01
  • 13. Create Useful Columns for Analysis.mp4
    03:48
  • 14. Replace a String with SUBSTITUTE.mp4
    06:30
  • 15. Identify Text Positions with SEARCH FIND.mp4
    04:58
  • 16. Cut Out Text Parts with LEFT MID RIGHT.mp4
    07:54
  • 17. Data Cleansing with SUBSTITUTE.mp4
    01:54
  • 18. Lookup Values with RELATED and RELATEDTABLE.mp4
    05:24
  • 19. Create an Aggregated Column with RELATEDTABLE.mp4
    05:26
  • 20. Join Text Strings with COMBINEVALUES.mp4
    02:53
  • 21. Capitalizing Text with UPPER and REPLACE.mp4
    02:33
  • 22. Creating Text Columns Summary.mp4
    00:35
  • 23. Create a Year and Month Column with FORMAT.mp4
    07:52
  • 24. Create Last Date in Month Columns with EOMONTH.mp4
    05:34
  • 25. Create the First Day of the Month with DATE.mp4
    03:01
  • 26. Create the First Day in the Last and Next Month with DATEADD.mp4
    04:45
  • 27. Comparing American and European Options with WEEKNUM.mp4
    05:28
  • 28. Create Week Number Columns with WEEKNUM.mp4
    05:28
  • 29. Create the Last Date in a Week Column with WEEKDAY.mp4
    03:39
  • 30. Create the First Date in a Week Column with WEEKDAY.mp4
    02:51
  • 31. Using Calendar Columns in Data Analysis.mp4
    04:56
  • 32. Creating Measures with Aggregation Functions.mp4
    04:03
  • 33. Introducing Aggregation Functions.mp4
    05:20
  • 34. Visualizing Measures and the Filter Context.mp4
    08:23
  • 35. Counting Sales with SUM and COUNTROWS.mp4
    01:49
  • 36. Creating Measures with AVERAGE MEDIAN MIN MAX and DISTINCTCOUNT.mp4
    02:46
  • 37. Filter Context Deep Dive.mp4
    04:56
  • 38. Calculate the Last Sales Date Column with an Aggregation Function.mp4
    04:19
  • 39. Creating Groups Bands and Hierarchies with Conditional Values.mp4
    05:25
  • 40. Creating Conditional Statements with SWITCH TRUE and IN.mp4
    06:18
  • 41. Implement Business Logic with AND OR NOT.mp4
    03:49
  • 42. Create Conditional SWITCH Statements with AND OR NOT.mp4
    08:12
  • 43. Creating Bands and Sorting Columns.mp4
    03:52
  • 44. Introducing Expression Variables with VAR.mp4
    03:06
  • 45. Ranking Products with FILTER VAR and COUNTROWS.mp4
    05:56
  • 46. Creating Intelligent Measures with Iterating X Functions.mp4
    04:11
  • 47. Calculating Total product Sales with SUMX and RELATEDTABLE .mp4
    05:35
  • 48. Static Ranking with RANKX.mp4
    02:48
  • 49. Creating a Ranking Measure with RANKX and ALL .mp4
    05:54
  • 50. Dynamic Ranking with RANKX and ALLSELECTED .mp4
    04:33
  • 51. Creating a Mobile Sales Measure with SUMX and FILTER.mp4
    05:54
  • 52. Creating a Red Product Sales Measure with VAR FILTER RELATED and SUMX.mp4
    01:25
  • 53. Calculating Multi Item Sales with VAR FILTER and SUMX.mp4
    00:48
  • 54. Calculating First and Latest Dates with MINX and MAXX.mp4
    01:11
  • 55. Calculating the Sales Value Percent with ALL and DIVIDE.mp4
    05:05
  • 56. Taking Control of the Evaluation Context with CALCULATE.mp4
    03:37
  • 57. Comparing the Inner Workings of Two Expressions.mp4
    02:46
  • 58. Introducing Calculate and Context Transition .mp4
    03:11
  • 59. Context Transition in Action.mp4
    02:59
  • 60. Creating a Semi Additive Measure with CALCULATE .mp4
    05:01
  • 61. Three Ways to Filter Semi Additive Measures with CALCULATE and FILTER.mp4
    07:03
  • 62. Filtering Measures with Time Intelligence Functions.mp4
    04:30
  • 63. Cumulative Year Analysis with TOTALYD and SAMEPERIODLASTYEAR.mp4
    04:36
  • 64. Analyse Promotion Activity over Time with DATEADD.mp4
    05:20
  • 65. Analyse Promotion Activity by Nesting DATEADD.mp4
    01:42
  • 66. Calculate Monthly Percentage Change with PREVIOUSMONTH.mp4
    04:03
  • 67. Calculate Moving Annual Totals with DATESINPERIOD and LASTDATE.mp4
    06:57
  • 68. Create a Key Performance Indicator with DATESINPERIOD and LASTDATE.mp4
    05:22
  • 69. Create Complex Attributes for RFM Analysis.mp4
    03:10
  • 70. Calculating Seniority with CALCULATE DATEADD DATEDIFF MINX and MAXX.mp4
    07:57
  • 71. Calculate Recency with CALCULATE and DATEDIFF.mp4
    05:42
  • 72. Calculating Frequency with CALCULATE and DISTINCTCOUNT.mp4
    03:32
  • 73. Customer Activity Measures and Multiple Filters.mp4
    05:31
  • 74. Demo-Recency Activity and Sales Value.mp4
    02:40
  • 75. Customer Activity Measures.mp4
    05:15
  • 76. Module and Course Summary.mp4
    00:50
  • Description


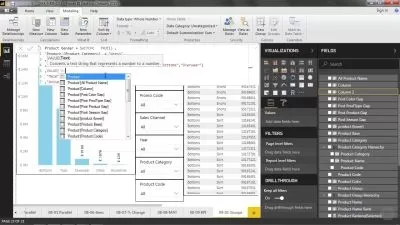
    In this course we'll build an intelligent data model to facilitate sales analysis for an online clothing retailer with the DAX Language in Power BI Desktop. Completing this course will grant you the knowledge needed to create data objects with DAX.

    What You'll Learn?


      As a data professional, have you ever wanted to produce an array of data objects using the DAX language? In this course, Common DAX Expressions and Scenarios Power BI Playbook, you will learn foundation skills in dimensional modelling and programming with the DAX Language in Power BI Desktop. First, you will learn the basic design principles. Next, you will discover how to write DAX code to implement the basic model framework. Finally, you will explore the DAX language and use it to extend and enhance the model. When you have completed this course, you will have the skills and knowledge needed to make your data available via a robust and flexible self service analytical interface. Software required: Power BI Desktop.

    More details


    User Reviews
    Rating
    0
    0
    0
    0
    0
    average 0
    Total votes0
    Focused display
    Andrew McSwiggan
    Andrew McSwiggan
    Instructor's Courses
    Passionate about Business Intelligence and delivering knowledge and insight to support better decisions. An advocate of Self-Service Reporting and Analytics and a Data Visualisation evangelist. Andi has delivered face to face Business Intelligence training to many industries, covering topics such as Report Design, Semantic Layer, Dimensional modeling and Data Visualisation. Andi has led many Data Warehouse and Business Intelligence development projects and is well versed in taking complex and chaotic data and turning it into something simple and easy to understand. Andi is a keen cyclist and amateur cook and lives with his wife in Southern Spain.
    Pluralsight, LLC is an American privately held online education company that offers a variety of video training courses for software developers, IT administrators, and creative professionals through its website. Founded in 2004 by Aaron Skonnard, Keith Brown, Fritz Onion, and Bill Williams, the company has its headquarters in Farmington, Utah. As of July 2018, it uses more than 1,400 subject-matter experts as authors, and offers more than 7,000 courses in its catalog. Since first moving its courses online in 2007, the company has expanded, developing a full enterprise platform, and adding skills assessment modules.
    • language english
    • Training sessions 76
    • duration 5:32:29
    • level preliminary
    • Release Date 2023/12/14