Certificate in Data analysis using R programming
Greg Martin
4:31:21
Description
A crash course for beginners
What You'll Learn?
- Clean your data
- Manipulate your data
- Describe and summarize your data
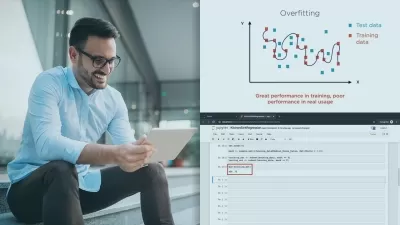
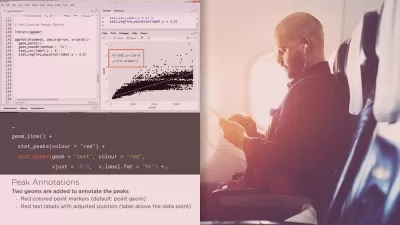
- Visualize your data (using ggplot)
- Analyze your data (t-test, ANOVA, chi-squared and linear regression)
Who is this for?
What You Need to Know?
More details
DescriptionThis R programming course will take you through the end-to-end process of data analysis, including cleaning, manipulating, summarizing, describing, visualizing and analysing your data. The data analysis section includes the t-test, ANOVA, chi-squared test and linear regression. Every lesson includes examples using data that is built into R (so you already have access to the data). That means that you'll be able to replicate absolutely every example in the course.
Learning statistics doesn’t need to be difficult or scary. In this course you’ll be brought through the process in a step-by-step fashion. The fact that all of the examples used in the course use datasets that are built into R means that you can practise each set of skills in your own time before moving onto the next step.
By the end of the course you'll feel completely comfortable with R programming. You'll be able to create incredible graphs and plots. You’ll understand the principles of hypothesis testing and how to perform statistical tests. Importantly, you’ll understand how to interpret the results of statistical tests. The teaching methods used in this course are designed to keep you engaged and make sure that you're excited about your new skills.
Good luck… and ENJOY!!
Who this course is for:
- From absolute beginners to intermediate users of R
- Anyone wanting to learn how to analyze data
This R programming course will take you through the end-to-end process of data analysis, including cleaning, manipulating, summarizing, describing, visualizing and analysing your data. The data analysis section includes the t-test, ANOVA, chi-squared test and linear regression. Every lesson includes examples using data that is built into R (so you already have access to the data). That means that you'll be able to replicate absolutely every example in the course.
Learning statistics doesn’t need to be difficult or scary. In this course you’ll be brought through the process in a step-by-step fashion. The fact that all of the examples used in the course use datasets that are built into R means that you can practise each set of skills in your own time before moving onto the next step.
By the end of the course you'll feel completely comfortable with R programming. You'll be able to create incredible graphs and plots. You’ll understand the principles of hypothesis testing and how to perform statistical tests. Importantly, you’ll understand how to interpret the results of statistical tests. The teaching methods used in this course are designed to keep you engaged and make sure that you're excited about your new skills.
Good luck… and ENJOY!!
Who this course is for:
- From absolute beginners to intermediate users of R
- Anyone wanting to learn how to analyze data
User Reviews
Rating

Greg Martin
Instructor's Courses
Udemy
View courses Udemy- language english
- Training sessions 12
- duration 4:31:21
- English subtitles has
- Release Date 2024/01/31