Build your own IOT applications and monitor data in your app
Mubeen Ali
5:08:08
Description
IOT applications from scratch with NodeMCU ESP8266, IOT data monitoring apps, Insert Arduino sensor data in database.
What You'll Learn?
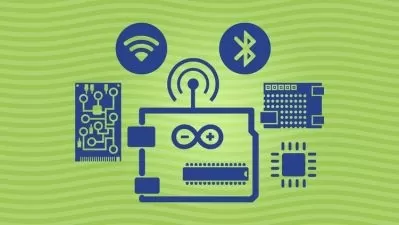
- Build IOT applications with nodeMCU ESP8266
- Connect nodeMCU ESP8266 with Google Firebase database and ThingSpeak cloud server
- Create user interface for IOT applications in python programming using the library plotly dash and control the microcontroller from your apps
- Importing and reading sensor data in python and saving in csv and excel file
- Inserting and retrieving sensors data in Google big query database
- Python library plotly dash
- Stream sensors data in python plotly dash application in real time
- Deploy python plotly dash application on Heroku cloud server and Google cloud server
- IOT data monitoring applications
Who is this for?
More details
DescriptionIn this course you will be taught how to create IOT applications from scratch with NodeMCU ESP8266. You will also learn how to control the microcontroller in your apps in Python programming with the library plotly dash. In this course you will also learn how to insert sensor data onto a cloud server using NodeMCU ESP8266. You will also learn how to retrieve it using Python applications and monitor data on your mobile device. In this course you will also learn how to connect microcontrollers to the Google Firebase database, ThingSpeak cloud server and insert data into the Google Big Query database.
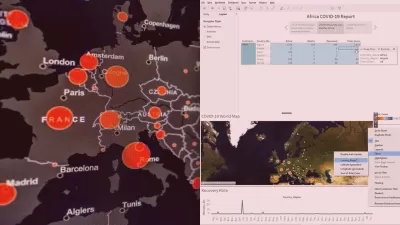
You will also learn in this course in the last four sections how to insert sensor data in the database and stream the data in real time in a python application. You will learn here how to create a user interface using the python library plotly dash and deploy the application on a cloud server to view data in real time. I have used DHT22 and MQ-135 sensors to measure temperature, humidity and level of carbon dioxide in the inside room and outside atmosphere. I have used the microcontroller Arduino and generated the data after each 5 seconds and then inserted the same time in the database. And then created the application in python using plotly dash application to retrieve data in this application and stream that data in real time. You will learn step by step how to use this application and how to create multi page and update data automatically over the selected period of time without refreshing the page.
After learning this course, you will be able to create your own application e.g. you can use different gas sensors, smoke sensors in your home to record data and after inserting in the database, you can monitor your house in your mobile and overcome any risks within time by creating your own application.
Who this course is for:
- This course is for those who want to build their own real time data applications and IOT applications.
In this course you will be taught how to create IOT applications from scratch with NodeMCU ESP8266. You will also learn how to control the microcontroller in your apps in Python programming with the library plotly dash. In this course you will also learn how to insert sensor data onto a cloud server using NodeMCU ESP8266. You will also learn how to retrieve it using Python applications and monitor data on your mobile device. In this course you will also learn how to connect microcontrollers to the Google Firebase database, ThingSpeak cloud server and insert data into the Google Big Query database.
You will also learn in this course in the last four sections how to insert sensor data in the database and stream the data in real time in a python application. You will learn here how to create a user interface using the python library plotly dash and deploy the application on a cloud server to view data in real time. I have used DHT22 and MQ-135 sensors to measure temperature, humidity and level of carbon dioxide in the inside room and outside atmosphere. I have used the microcontroller Arduino and generated the data after each 5 seconds and then inserted the same time in the database. And then created the application in python using plotly dash application to retrieve data in this application and stream that data in real time. You will learn step by step how to use this application and how to create multi page and update data automatically over the selected period of time without refreshing the page.
After learning this course, you will be able to create your own application e.g. you can use different gas sensors, smoke sensors in your home to record data and after inserting in the database, you can monitor your house in your mobile and overcome any risks within time by creating your own application.
Who this course is for:
- This course is for those who want to build their own real time data applications and IOT applications.
User Reviews
Rating

Mubeen Ali
Instructor's Courses
Udemy
View courses Udemy- language english
- Training sessions 31
- duration 5:08:08
- Release Date 2023/02/20


![Dashboard Design Fundamentals [2022] - Dashboards that work](https://traininghub.ir/image/course_pic/1747-x225.webp)