BI Analyst Tools: (Excel, VBA, SQL, Power Query, Power BI)
Bluelime Learning Solutions
13:36:15
Description
Mastering Data Visualization and Analytics with BI Tools: (Excel, VBA, SQL, Power Query, DAX, Macros, Power BI)
What You'll Learn?
- Understanding the importance and role of data analysis in a business context.
- Familiarity with key tools in data analysis, including Power BI, SQL, Excel, and DAX.
- Ability to connect Power BI to various data sources.
- Skills to clean and transform raw data for analysis using Power Query in Power BI.
- Proficiency in writing SQL queries for data extraction and manipulation.
- Developing and working with databases in SQL, including concepts such as Joins, Views, and Stored Procedures.
- Understanding how to use Excel for data analysis, including sorting, filtering, and use of formulas and functions.
- Advanced Excel skills such as data validation and what-if analysis.
- Mastery of PivotTables and PivotCharts in Excel.
- Understanding the basics of DAX, including its syntax and various functions.
- Ability to create calculated columns and measures using DAX.
- Mastering advanced DAX concepts like Time Intelligence functions.
- Creating relational data models in Power BI.
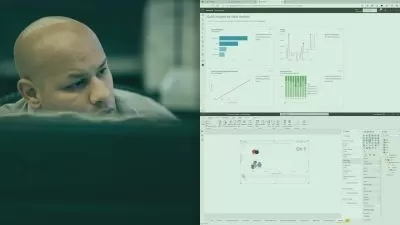
- Designing interactive visuals in Power BI, including charts, graphs, and tables.
- Understanding the principles of good dashboard design.
- Creating effective, business-oriented dashboards in Power BI.
- Ability to tell compelling stories with data.
- Ability to tell compelling stories with data.
- Hands-on experience of building a business-oriented dashboard in a Capstone Project.
- Confidence and competence to use Power BI, SQL, Excel, and DAX in real-world business scenarios for data analysis and visualization.
Who is this for?
What You Need to Know?
More details
DescriptionWelcome to " BI Analyst Tools: Unleashing Business Intelligence," an immersive course designed to guide you through the world of data analysis using state-of-the-art tools such as Power BI, SQL, Excel, and DAX. Whether you're a novice just starting your journey, or an established professional seeking to enhance your toolkit, this course offers an expansive insight into the realm of data analysis, visualization, and business intelligence.
Today, the business landscape is becoming increasingly data-driven. Every business decision is underpinned by data, insights, and analytics. Recognizing this shift, our course intends to impart the skills necessary to navigate, analyze, and interpret complex data, allowing you to harness its power and drive strategic decision-making.
The course kicks off with a fundamental understanding of data analysis, its role, and significance in business. As we progress, we'll delve into the basics of Power BI, SQL, Excel, and DAX, essential tools for any data analyst. You'll learn how to gather, clean, and transform data, preparing it for insightful analysis.
As we dive deeper, we'll explore DAX, a library of functions and operators that provide the muscle for crunching numerical data. We'll then move on to one of the most exciting aspects of data analysis: visualizations. You'll learn how to design and implement interactive charts, graphs, and other visuals, and arrange them in a compelling dashboard that tells the story hidden within your data.
Excel, a classic tool with robust capabilities, plays an essential role in our course. We'll navigate its features, from basic functions to pivot tables, exploring how it can be employed in data analysis. With SQL, we'll show you how to query databases to retrieve and manipulate data, essential skills for working with large datasets.
Perhaps one of the most rewarding parts of this course is the Capstone Project. You'll apply the skills you've learned to create a business-oriented dashboard, incorporating elements from Power BI, SQL, Excel, and DAX. This hands-on experience is designed to solidify your learning and provide a taste of real-world data analysis projects.
This course is for anyone with a desire to understand data and draw insights from it. No prior knowledge of Power BI, SQL, Excel, or DAX is required—only a willingness to learn and a fascination with data. The course is ideal for beginners interested in data analysis, professionals seeking to enhance their data analysis skills, business professionals, and students in business or data science disciplines.
In conclusion, " BI Analyst Tools: Unleashing Business Intelligence" is more than just a course—it's your gateway to the intriguing world of data analysis. Upon completion, you'll not only understand how to use Power BI, SQL, Excel, and DAX, but you'll also know how to weave them together to create captivating dashboards that make data speak. Embark on this journey with us and discover the transformative power of data analysis and business intelligence.
Who this course is for:
- Beginners interested in learning data analysis and business intelligence tools.
- Professionals who want to enhance their data analysis skills.
- Data analysts aiming to learn new tools and techniques.
- Data analysts aiming to learn new tools and techniques.
- Students in the fields of business, data science, or related disciplines looking to augment their skills.
Welcome to " BI Analyst Tools: Unleashing Business Intelligence," an immersive course designed to guide you through the world of data analysis using state-of-the-art tools such as Power BI, SQL, Excel, and DAX. Whether you're a novice just starting your journey, or an established professional seeking to enhance your toolkit, this course offers an expansive insight into the realm of data analysis, visualization, and business intelligence.
Today, the business landscape is becoming increasingly data-driven. Every business decision is underpinned by data, insights, and analytics. Recognizing this shift, our course intends to impart the skills necessary to navigate, analyze, and interpret complex data, allowing you to harness its power and drive strategic decision-making.
The course kicks off with a fundamental understanding of data analysis, its role, and significance in business. As we progress, we'll delve into the basics of Power BI, SQL, Excel, and DAX, essential tools for any data analyst. You'll learn how to gather, clean, and transform data, preparing it for insightful analysis.
As we dive deeper, we'll explore DAX, a library of functions and operators that provide the muscle for crunching numerical data. We'll then move on to one of the most exciting aspects of data analysis: visualizations. You'll learn how to design and implement interactive charts, graphs, and other visuals, and arrange them in a compelling dashboard that tells the story hidden within your data.
Excel, a classic tool with robust capabilities, plays an essential role in our course. We'll navigate its features, from basic functions to pivot tables, exploring how it can be employed in data analysis. With SQL, we'll show you how to query databases to retrieve and manipulate data, essential skills for working with large datasets.
Perhaps one of the most rewarding parts of this course is the Capstone Project. You'll apply the skills you've learned to create a business-oriented dashboard, incorporating elements from Power BI, SQL, Excel, and DAX. This hands-on experience is designed to solidify your learning and provide a taste of real-world data analysis projects.
This course is for anyone with a desire to understand data and draw insights from it. No prior knowledge of Power BI, SQL, Excel, or DAX is required—only a willingness to learn and a fascination with data. The course is ideal for beginners interested in data analysis, professionals seeking to enhance their data analysis skills, business professionals, and students in business or data science disciplines.
In conclusion, " BI Analyst Tools: Unleashing Business Intelligence" is more than just a course—it's your gateway to the intriguing world of data analysis. Upon completion, you'll not only understand how to use Power BI, SQL, Excel, and DAX, but you'll also know how to weave them together to create captivating dashboards that make data speak. Embark on this journey with us and discover the transformative power of data analysis and business intelligence.
Who this course is for:
- Beginners interested in learning data analysis and business intelligence tools.
- Professionals who want to enhance their data analysis skills.
- Data analysts aiming to learn new tools and techniques.
- Data analysts aiming to learn new tools and techniques.
- Students in the fields of business, data science, or related disciplines looking to augment their skills.
User Reviews
Rating
Bluelime Learning Solutions
Instructor's Courses
Udemy
View courses Udemy- language english
- Training sessions 138
- duration 13:36:15
- Release Date 2023/07/24


