Become a Data Analyst: Excel, SQL & Tableau - 3-in-1 Bundle
Start-Tech Academy
25:50:18
Description
Boost Your Career with Data Analytics: Learn Excel, SQL & Tableau for Advanced Business Insights & Competitive Advantage
What You'll Learn?
- Discover the power of Excel and use it to manipulate and analyze data like a pro.
- Master SQL queries to extract, filter, and aggregate data from relational databases.
- Explore Tableau's interface and create stunning visualizations that communicate insights.
- Develop the skills to integrate data from multiple sources and create interactive dashboards in Tableau.
- Apply best practices for data cleaning, wrangling, and transformation in Excel and SQL
- Create dynamic and automated reports in Tableau that update with new data.
- Use Excel and Tableau to identify trends, patterns, and outliers in data.
- Develop a data-driven mindset and use data to make informed business decisions.
- Apply critical thinking and problem-solving skills to data analysis challenges.
Who is this for?
More details
DescriptionIf you are interested in becoming a data analyst, but feel overwhelmed by the technical skills required, this "Become a Data Analyst: Excel, SQL & Tableau - 3-in-1 Bundle" course is designed for you. You'll learn Excel, SQL, and Tableau - the essential tools for data analysis - and develop the skills to turn raw data into insights that drive better business decisions.
In this course, you will:
Develop advanced Excel skills to manipulate and analyze data
Master SQL queries to extract data from databases
Create stunning data visualizations in Tableau to communicate insights
Learning these skills will allow you to excel as a data analyst, and open up new career opportunities. You'll practice real-world examples and complete hands-on exercises, so you can apply your new skills to real-world situations.
This course is different because it offers a comprehensive, 3-in-1 bundle approach that covers all of the key skills required to become a successful data analyst. The course is also taught in an engaging and easy-to-understand format, so you can learn at your own pace and confidently apply your skills in the workplace.
What makes us qualified to teach you?
The course is taught by Abhishek (MBA - FMS Delhi, B. Tech - IIT Roorkee) and Pukhraj (MBA - IIM Ahmedabad, B. Tech - IIT Roorkee). As managers in the Global Analytics Consulting firm, we have helped businesses solve their business problems using Analytics and we have used our experience to include the practical aspects of business analytics in this course. We have in-hand experience in Business Analysis.
We are also the creators of some of the most popular online courses - with over 1,200,000 enrollments and thousands of 5-star reviews like these ones:
This is very good, i love the fact the all explanation given can be understood by a layman - Joshua
Thank you Author for this wonderful course. You are the best and this course is worth any price. - Daisy
What is covered in this course?
The analysis of data is not the main crux of analytics. It is the interpretation that helps provide insights after the application of analytical techniques that makes analytics such an important discipline. We have used the most popular analytics software tools which are MS Excel, SQL, and Tableau. This will aid the students who have no prior coding background to learn and implement Analytics and Machine Learning concepts to actually solve real-world problems of Data Analysis.
Let me give you a brief overview of the course
Part 1 - Excel for data analytics
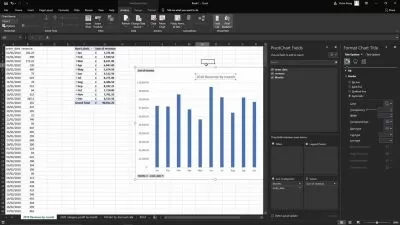
In the first section, i.e. Excel for data analytics, we will learn how to use excel for data-related operations such as calculating, transforming, matching, filtering, sorting, and aggregating data.
We will also cover how to use different types of charts to visualize the data and discover hidden data patterns.
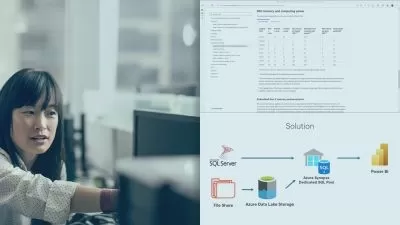
Part 2 - SQLÂ for data analytics
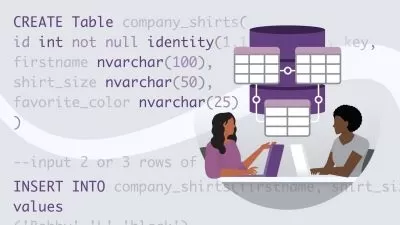
IN the second section, i.e. SQL for data analytics, we will be teaching you everything in SQL that you will need for Data analysis in businesses. We will start with basic data operations like creating a table, retrieving data from a table etc. Later on, we will learn advanced topics like subqueries, Joins, data aggregation, and pattern matching.
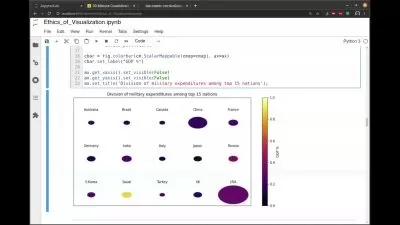
Part 3 - Data visualization using Tableau
In this section, you will learn how to develop stunning dashboards, visualizations and insights that will allow you to explore, analyze and communicate your data effectively. You will master key Tableau concepts such as data blending, calculations, and mapping. By the end of the course, you will be able to create engaging visualizations that will enable you to make data-driven decisions confidently.
Our Promise
Teaching our students is our job and we are committed to it. If you have any questions about the course content, practice sheet, or anything related to any topic, you can always post a question in the course or send us a direct message.
Don't let technical skills hold you back from pursuing a career in data analysis. Enroll now and start your journey towards becoming a data analyst.
Who this course is for:
- Anyone curious to master Data Analysis in a short span of time
- Individuals who want to pursue a career in data analysis, business intelligence, or data visualization
- Professionals who want to upskill and add value to their existing roles by learning data analysis
- Aspiring data analysts who want to develop the skills to turn raw data into actionable insights
- Small business owners who want to use data to drive better decision-making in their companies
If you are interested in becoming a data analyst, but feel overwhelmed by the technical skills required, this "Become a Data Analyst: Excel, SQL & Tableau - 3-in-1 Bundle" course is designed for you. You'll learn Excel, SQL, and Tableau - the essential tools for data analysis - and develop the skills to turn raw data into insights that drive better business decisions.
In this course, you will:
Develop advanced Excel skills to manipulate and analyze data
Master SQL queries to extract data from databases
Create stunning data visualizations in Tableau to communicate insights
Learning these skills will allow you to excel as a data analyst, and open up new career opportunities. You'll practice real-world examples and complete hands-on exercises, so you can apply your new skills to real-world situations.
This course is different because it offers a comprehensive, 3-in-1 bundle approach that covers all of the key skills required to become a successful data analyst. The course is also taught in an engaging and easy-to-understand format, so you can learn at your own pace and confidently apply your skills in the workplace.
What makes us qualified to teach you?
The course is taught by Abhishek (MBA - FMS Delhi, B. Tech - IIT Roorkee) and Pukhraj (MBA - IIM Ahmedabad, B. Tech - IIT Roorkee). As managers in the Global Analytics Consulting firm, we have helped businesses solve their business problems using Analytics and we have used our experience to include the practical aspects of business analytics in this course. We have in-hand experience in Business Analysis.
We are also the creators of some of the most popular online courses - with over 1,200,000 enrollments and thousands of 5-star reviews like these ones:
This is very good, i love the fact the all explanation given can be understood by a layman - Joshua
Thank you Author for this wonderful course. You are the best and this course is worth any price. - Daisy
What is covered in this course?
The analysis of data is not the main crux of analytics. It is the interpretation that helps provide insights after the application of analytical techniques that makes analytics such an important discipline. We have used the most popular analytics software tools which are MS Excel, SQL, and Tableau. This will aid the students who have no prior coding background to learn and implement Analytics and Machine Learning concepts to actually solve real-world problems of Data Analysis.
Let me give you a brief overview of the course
Part 1 - Excel for data analytics
In the first section, i.e. Excel for data analytics, we will learn how to use excel for data-related operations such as calculating, transforming, matching, filtering, sorting, and aggregating data.
We will also cover how to use different types of charts to visualize the data and discover hidden data patterns.
Part 2 - SQLÂ for data analytics
IN the second section, i.e. SQL for data analytics, we will be teaching you everything in SQL that you will need for Data analysis in businesses. We will start with basic data operations like creating a table, retrieving data from a table etc. Later on, we will learn advanced topics like subqueries, Joins, data aggregation, and pattern matching.
Part 3 - Data visualization using Tableau
In this section, you will learn how to develop stunning dashboards, visualizations and insights that will allow you to explore, analyze and communicate your data effectively. You will master key Tableau concepts such as data blending, calculations, and mapping. By the end of the course, you will be able to create engaging visualizations that will enable you to make data-driven decisions confidently.
Our Promise
Teaching our students is our job and we are committed to it. If you have any questions about the course content, practice sheet, or anything related to any topic, you can always post a question in the course or send us a direct message.
Don't let technical skills hold you back from pursuing a career in data analysis. Enroll now and start your journey towards becoming a data analyst.
Who this course is for:
- Anyone curious to master Data Analysis in a short span of time
- Individuals who want to pursue a career in data analysis, business intelligence, or data visualization
- Professionals who want to upskill and add value to their existing roles by learning data analysis
- Aspiring data analysts who want to develop the skills to turn raw data into actionable insights
- Small business owners who want to use data to drive better decision-making in their companies
User Reviews
Rating

Start-Tech Academy
Instructor's Courses
Udemy
View courses Udemy- language english
- Training sessions 211
- duration 25:50:18
- Release Date 2023/04/25