Applied Statistics in Python and ChatGPT
StatElite Academy
3:32:09
Description
Statistics and Hypothesis Testing to Find Insights. Develop Regression Models and Turn Data into Strategic Actions.
What You'll Learn?
- Learn how to understand data and hone your skills in inferential, descriptive, and hypothesis testing statistics.
- Discover how to use descriptive statistical measures, such as mean, median, variance, and standard deviation, to summarize and understand data.
- Python tools for cleaning, modifying, and analyzing real-world data include pandas, numpy, seaborn, matplotlib, scipy, and scikit-learn.
- Establish a methodical procedure for data analysis that includes conversion, cleaning, and the use of statistical techniques to guarantee quality and accuracy.
- Learn how to set up, run, and comprehend one-sample, independent sample, crosstabulation, association tests, and one-way ANOVA for hypothesis testing.
- Gaining a rudimentary understanding of regression analysis will enable you to foresee and model variable relationships—a critical skill for making informed deci
- Use python to show complex, interactive statistical visualizations including box plots, KDE plots, clustered bar charts, histograms, heatmaps, and bar plots.
- Full explanation on each Python code that is used to solve statistical challenges. This will make the use of statistical analysis more clear.
Who is this for?
What You Need to Know?
More details
DescriptionUnlock the power of data through the Applied Statistics and Analytics course, where you will embark on a comprehensive journey of statistical analysis and data interpretation using Python and ChatGPT. This course is designed to equip you with essential skills in hypothesis testing, descriptive statistics, inferential statistics, and regression analysis, empowering you to transform raw data into strategic insights.
Key Learning Objectives:
Foundational Statistical Concepts:
Develop a solid understanding of hypothesis testing, descriptive statistics, and inferential statistics.
Learn to interpret data by applying statistical metrics such as mean, median, variance, and standard deviation.
Python Tools for Data Analysis:
Acquire proficiency in utilizing Python tools like pandas, numpy, seaborn, matplotlib, scipy, and scikit-learn for cleaning, altering, and analyzing real-world data.
Establish a systematic data analysis process encompassing data cleaning, transformation, and the application of statistical approaches to ensure accuracy and quality.
Hypothesis Testing Mastery:
Gain hands-on experience in organizing, conducting, and understanding various hypothesis tests, including one-sample, independent sample, crosstabulation, association tests, and one-way ANOVA.
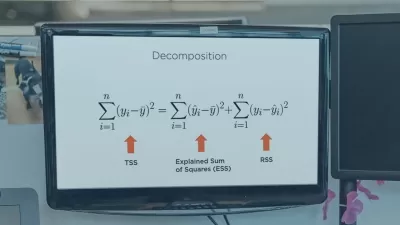
Regression Analysis Essentials:
Learn the fundamentals of regression analysis to model and forecast variable relationships, enabling you to make informed and strategic decisions based on data insights.
Python for Statistical Visualization:
Harness the power of Python for creating complex and interactive statistical visualizations. Explore visualization techniques such as clustered bar charts, histograms, box plots, KDE plots, heatmaps, and bar plots to present data clearly and persuasively.
By the end of this course, you will not only be proficient in statistical analysis using Python but also capable of transforming data into actionable insights, making you an invaluable asset in the data-driven decision-making landscape. Join us on this transformative journey into the world of Applied Statistics and Analytics, where data speaks, and you have the skills to listen.
Who this course is for:
- People who want to work in data analysis and want an easy-to-understand introduction to the world of numbers
- People who work in business intelligence and want to make decisions based on data can
- People who use data on the job to make assumptions, estimates, or guesses using statistics
- Students who want to learn strong, useful skills through unique, hands-on projects and demos
Unlock the power of data through the Applied Statistics and Analytics course, where you will embark on a comprehensive journey of statistical analysis and data interpretation using Python and ChatGPT. This course is designed to equip you with essential skills in hypothesis testing, descriptive statistics, inferential statistics, and regression analysis, empowering you to transform raw data into strategic insights.
Key Learning Objectives:
Foundational Statistical Concepts:
Develop a solid understanding of hypothesis testing, descriptive statistics, and inferential statistics.
Learn to interpret data by applying statistical metrics such as mean, median, variance, and standard deviation.
Python Tools for Data Analysis:
Acquire proficiency in utilizing Python tools like pandas, numpy, seaborn, matplotlib, scipy, and scikit-learn for cleaning, altering, and analyzing real-world data.
Establish a systematic data analysis process encompassing data cleaning, transformation, and the application of statistical approaches to ensure accuracy and quality.
Hypothesis Testing Mastery:
Gain hands-on experience in organizing, conducting, and understanding various hypothesis tests, including one-sample, independent sample, crosstabulation, association tests, and one-way ANOVA.
Regression Analysis Essentials:
Learn the fundamentals of regression analysis to model and forecast variable relationships, enabling you to make informed and strategic decisions based on data insights.
Python for Statistical Visualization:
Harness the power of Python for creating complex and interactive statistical visualizations. Explore visualization techniques such as clustered bar charts, histograms, box plots, KDE plots, heatmaps, and bar plots to present data clearly and persuasively.
By the end of this course, you will not only be proficient in statistical analysis using Python but also capable of transforming data into actionable insights, making you an invaluable asset in the data-driven decision-making landscape. Join us on this transformative journey into the world of Applied Statistics and Analytics, where data speaks, and you have the skills to listen.
Who this course is for:
- People who want to work in data analysis and want an easy-to-understand introduction to the world of numbers
- People who work in business intelligence and want to make decisions based on data can
- People who use data on the job to make assumptions, estimates, or guesses using statistics
- Students who want to learn strong, useful skills through unique, hands-on projects and demos
User Reviews
Rating

StatElite Academy
Instructor's Courses
Udemy
View courses Udemy- language english
- Training sessions 25
- duration 3:32:09
- Release Date 2024/03/16