Companies Home Search Profile

Advanced Spring: Spring Boot Actuator

Focused View

Mikaila Akeredolu

1:13:03

75 View
  • 001. Need to monitor the performance of your applications.mp4
    00:57
  • 002. What you should know.mp4
    00:22
  • 003. Introduction to Spring Boot Actuator.mp4
    03:10
  • 004. Actuator endpoints and documentation.mp4
    02:12
  • 005. Exposing and enabling endpoints.mp4
    05:25
  • 006. Show details and create health endpoint groups.mp4
    04:04
  • 007. Show application information with the info endpoint.mp4
    04:10
  • 008. Overriding the Actuator base path.mp4
    04:36
  • 009. Implementing the Health Indicator interface.mp4
    06:12
  • 010. Creating a custom Actuator endpoint.mp4
    04:21
  • 011. How to secure Actuator endpoints with Spring Security.mp4
    07:04
  • 012. Spring Boot Actuator metrics and Prometheus.mp4
    01:43
  • 013. Micrometer Prometheus registry.mp4
    02:14
  • 014. Prometheus configuration.mp4
    01:56
  • 015. Installing and running a Prometheus Docker image.mp4
    02:50
  • 016. Take the Prometheus UI for a spin.mp4
    02:33
  • 017. Adding custom metrics.mp4
    04:22
  • 018. Viewing custom metrics from the Prometheus UI.mp4
    03:35
  • 019. Installing and running a Grafana Docker image.mp4
    02:45
  • 020. Import metrics data from Prometheus to Grafana.mp4
    01:50
  • 021. Creating dashboards with Grafana.mp4
    05:12
  • 022. Next steps.mp4
    01:30
  • Description


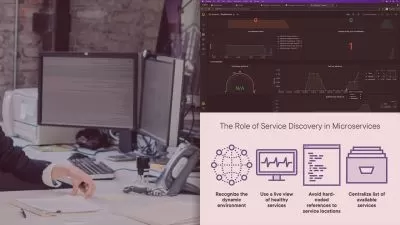
    Are you a Java developer with a need to monitor the performance of your applications? In this advanced course, award-winning technical instructor Mikaila Akeredolu gives you an overview of the dashboard that you build in this course using Spring Boot Actuator, Prometheus, and Grafana. Then he dives into specifics. Mikaila introduces you to monitoring and managing Spring Boot applications with Spring Boot Actuator. He explains endpoints, endpoint groups, and how to override the Actuator base path. Mikaila walks you through the process to create and secure endpoints, then shows you how to leverage Micrometer and Prometheus to store and query metrics from your applications. Mikaila finishes up with a detailed discussion of Grafana dashboards, which make it easier to visualize multiple metrics across multiple stacks on the same screen.

    More details


    User Reviews
    Rating
    0
    0
    0
    0
    0
    average 0
    Total votes0
    Focused display
    Category
    Mikaila Akeredolu
    Mikaila Akeredolu
    Instructor's Courses
    Currently rebuilding Tech552.com. Experienced Technical Trainer, Software Developer and Linkedinlearning Instructor with a demonstrated history of working in the computer software industry. Skilled in teaching software development and programming with languages such as Java and JavaScript. Strong program and project management professional with both a Bachelors Degree in Marketing from Wilmington University and a Computer Information Systems degree from Queensborough Community College in Queens, NY with a concentration on software analysis and design. Passionate about empowering future technologist!
    LinkedIn Learning is an American online learning provider. It provides video courses taught by industry experts in software, creative, and business skills. It is a subsidiary of LinkedIn. All the courses on LinkedIn fall into four categories: Business, Creative, Technology and Certifications. It was founded in 1995 by Lynda Weinman as Lynda.com before being acquired by LinkedIn in 2015. Microsoft acquired LinkedIn in December 2016.
    • language english
    • Training sessions 22
    • duration 1:13:03
    • Release Date 2022/12/28