Companies Home Search Profile

Advanced Microsoft Interactive and Dynamic Excel Dashboard

Focused View

Ismaila Mumin Omeiza

13:34:26

233 View
  • 1 - Why do we need to use Power Query Power Pivot.mp4
    02:36
  • 2 - Advanced Process to a Better Dashboard Creation.mp4
    01:50
  • 3 - All-Resources.zip
  • 3 - Course Materials.mp4
    01:01
  • 4 - All-Resources.zip
  • 4 - Complet-Dashboard.zip
  • 4 - Complet-Dataset-for-practice.zip
  • 4 - Customer-Dashboard-and-dataset.zip
  • 4 - Project Overview.mp4
    02:44
  • 5 - How to Activate Microsoft Excel Power Pivot.mp4
    03:03
  • 6 - Importing data into Power Query.mp4
    06:05
  • 7 - Power Query Transform vs Add Columns explained.mp4
    11:12
  • 8 - Importing Multiple tables into Power Query.mp4
    05:00
  • 9 - Updating your current Workbook Settings to get proper Dates and Time.mp4
    06:03
  • 10 - Checking errors and remove columns and rows in Power Query.mp4
    07:45
  • 11 - How to add Index number in Power Query.mp4
    06:50
  • 12 - Merging Queries in Power Query.mp4
    05:57
  • 13 - Basic way to Append Queries.mp4
    09:00
  • 14 - Best way to Append Queries using Folder with Auto Update.mp4
    07:27
  • 15 - Creating a Custom Calendar Table in Power Query.mp4
    12:26
  • 16 - Better way to Create a Date Table in Power Query Auto Update.mp4
    06:18
  • 17 - How to Move data into Power Pivot from Worksheet.mp4
    03:06
  • 18 - Important Data Source Settings in Power Query.mp4
    05:16
  • 19 - Data view vs Diagram view.mp4
    04:17
  • 20 - Understand Database Normalization.mp4
    04:02
  • 21 - Creating Relationships in Power Pivot.mp4
    09:38
  • 22 - How to Edit Relationships in Power Pivot.mp4
    07:39
  • 23 - Power Pivot view vs Normal Excel Pivot Table.mp4
    06:04
  • 24 - Power Query and Data Modelling conclusion.mp4
    00:29
  • 25 - Introduction to DAX in Excel Power Pivot.mp4
    01:38
  • 26 - How to add DAX Calculated Column.mp4
    09:25
  • 27 - Calculated Column with Dax If function.mp4
    04:39
  • 28 - Calculated Column with Dax Switch function.mp4
    04:31
  • 29 - Total Revenue with Calculated Column.mp4
    06:26
  • 30 - Introduction to DAX Measures in Power Pivot.mp4
    14:44
  • 31 - How to write DAX using the Measure BOX.mp4
    06:48
  • 32 - Implicit vs Explicit Measures.mp4
    07:15
  • 33 - How to create a Separate Measures Table.mp4
    12:18
  • 34 - How to calculate COGS and Gross profit.mp4
    03:38
  • 35 - Calculating returned Rate using DAX.mp4
    11:55
  • 36 - How to use DAX All Function.mp4
    07:34
  • 37 - How to use the DAX Filter Function.mp4
    06:10
  • 38 - Filtering Table with DAX Function.mp4
    07:36
  • 39 - How to mark your Date Table.mp4
    00:37
  • 40 - Time Intelligence YTD MTD and QTD DAX Function.mp4
    09:47
  • 41 - Last month Revenue and MoM percentage Change.mp4
    16:50
  • 42 - How to calculate 10Days Rolling total.mp4
    04:27
  • 43 - How to calculate 10 Days Transactional Average.mp4
    02:55
  • 44 - Better to Count using DAX.mp4
    08:34
  • 45 - Dashboard overview.mp4
    02:26
  • 46 - Setting Dashboard Canvas.mp4
    06:56
  • 47 - How to add MCode Last Update date code.mp4
    11:01
  • 48 - Adding values to cards.mp4
    09:48
  • 49 - Adding Icons.mp4
    04:59
  • 50 - Adding new cards with Gradient colors.mp4
    11:31
  • 51 - How to create a Dynamic Top N in Excel.mp4
    17:29
  • 52 - Creating a dynamic Title.mp4
    07:22
  • 53 - How to create multiple Doughnut chart.mp4
    18:58
  • 54 - Inserting a Bar charts.mp4
    17:01
  • 55 - How to create a Map chart.mp4
    15:18
  • 56 - 5 Less and Top Profitable Cities.mp4
    03:36
  • 57 - How to connect Slicers to PivotTables.mp4
    05:12
  • 58 - Adidas-Dataset.zip
  • 58 - Adidas-dashboard.zip
  • 58 - Dashboard Overview.mp4
    03:28
  • 59 - Transforming and Cleaning data with Power Query.mp4
    10:40
  • 60 - Inserting PivotTable and Advanced Number formatting.mp4
    06:44
  • 61 - Adding Month Filter.mp4
    11:01
  • 62 - Dynamic way to show previous Month revenue with Percentage Change.mp4
    22:53
  • 63 - Quantity Ordered and Transaction Cards.mp4
    03:59
  • 64 - Which Product contributed more to Revenue.mp4
    27:04
  • 65 - Which State should we push more Products to.mp4
    24:19
  • 66 - What is the peak month for 2020 and 2021.mp4
    20:47
  • 67 - Whats our top Region Sales Channel.mp4
    11:41
  • 68 - Revenue trend by Weekday.mp4
    10:55
  • 69 - Connecting Slicers to PivotTables.mp4
    05:37
  • 70 - How to create a Single Button that clear all filters.mp4
    04:37
  • 71 - New way to save your work.mp4
    01:27
  • 72 - Formatting Slicers.mp4
    14:38
  • 73 - Cleaning up your dashboard.mp4
    09:31
  • 74 - Animated-Images.zip
  • 74 - Complet-HR-Dashboard.zip
  • 74 - Dashboard Overview.mp4
    01:22
  • 74 - HR-Dataset.zip
  • 75 - Importing data into Excel Power Query.mp4
    10:04
  • 76 - Removing unwanted columns in Power Query.mp4
    06:24
  • 77 - Transforming Hr data in Excel Power Query.mp4
    19:47
  • 78 - Cleaning the Dashboard area Canvas.mp4
    03:46
  • 79 - Formatting your DataTable.mp4
    06:22
  • 80 - 06 Employees KPI.mp4
    06:45
  • 81 - Adding shapes to the dashboard environment.mp4
    06:04
  • 82 - How to download Gif animated images to Excel.mp4
    08:23
  • 83 - Creating chart for attrition and current employees.mp4
    10:11
  • 84 - Employees by performance Status.mp4
    12:21
  • 85 - How to create an icon slicer in Excel.mp4
    08:33
  • 86 - Attrition by distance from work with dynamic legend.mp4
    10:39
  • 87 - Attrition by job role visual.mp4
    14:25
  • 88 - Formatting legends.mp4
    03:21
  • 89 - Job role average Attrition.mp4
    02:31
  • 90 - Attrition by Education types.mp4
    05:06
  • 91 - How to create a custom chart in Microsoft Excel.mp4
    20:52
  • 92 - Attrition by age Bucket and Gender.mp4
    06:27
  • 93 - Custom chart for Gender.mp4
    19:36
  • 94 - Average Age for employees.mp4
    04:35
  • 95 - How to format Excel Slicers.mp4
    18:18
  • 96 - Final formatting.mp4
    04:01
  • Description


    2023 (Edition) Start an Advanced Excel Dashboard Today using Power Pivot, DAX, Power Query and Advanced Excel Functions

    What You'll Learn?


    • Learn how to write DAX (Data analysis Expression) to create advanced dashboard in Excel
    • Learn how to use Power Pivot and Power Query in Excel for advanced data Analysis
    • Mix formula and function with Pivot Table to create interacive dashboard
    • How to use data to make business decisions
    • How to market your new dashboard skill
    • How to create Portfolio to showcase your dashboard to prospective Employers

    Who is this for?


  • A data analyst
  • Anyone working with data
  • A manager
  • Business owners
  • Students
  • More details


    Description

    If you are really new to Excel dashboards or data analytics in general or you want to advance your knowledge, this is the course for you. We have provided you with the fundamentals you need to work with Excel efficiently and effectively.


    This dashboard is going to take you through Power Query, Power Pivot, Modeling, and DAX (Data Analysis Expression).


    Learning this advanced Excel Dashboard will make you use Power BI with ease as it uses DAX for computation and Power Query for cleaning and data transformation.


    Our aim in this course is to show you how to analyze data and create a visualization from the different tables without you using Xlookup, VLOOKUP or Index and Match but just with simple data Modeling in Power Pivot.


    This course is 100% practical


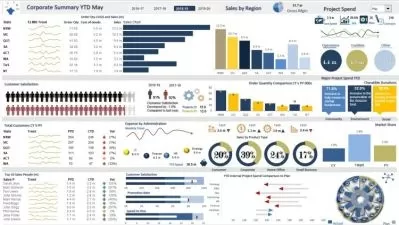
    Microsoft Excel is the most commonly used data analysis tool available on the market today. In this course, we show you how to create POWERFUL INTERACTIVE dashboards in minutes using standard Excel tools and techniques. (No coding or complicated methods required!)


    Say no to a boring dashboard. With this course, you will start creating a very powerful interactive and dynamic Excel dashboard from day one.


    If you are ready to learn with me, let's join the class and see how creative you could be in the few days to come as you begin the class.


    Remember you have life Time access to this course.

    This course will be updated frequently with the new dashboard.

    be free to ask questions should you got stuck in any of the steps.


    I am already waiting for you in the class, nice to have you.


    Who this course is for:

    • A data analyst
    • Anyone working with data
    • A manager
    • Business owners
    • Students

    User Reviews
    Rating
    0
    0
    0
    0
    0
    average 0
    Total votes0
    Focused display
    Ismaila Mumin Omeiza
    Ismaila Mumin Omeiza
    Instructor's Courses
    As a person with a very high keenness in data analytics with over 6 years of practical experience, I have brought my knowledge and skill to help you learn data analytics with ease.as a student of Technology and data analytics, my aim is to give you an industry-standard training course that will make you thrive.Over the years, I have been working from home as a freelance data analyst with several companies across the world and I am here to show you I did it.
    Students take courses primarily to improve job-related skills.Some courses generate credit toward technical certification. Udemy has made a special effort to attract corporate trainers seeking to create coursework for employees of their company.
    • language english
    • Training sessions 96
    • duration 13:34:26
    • Release Date 2023/04/25